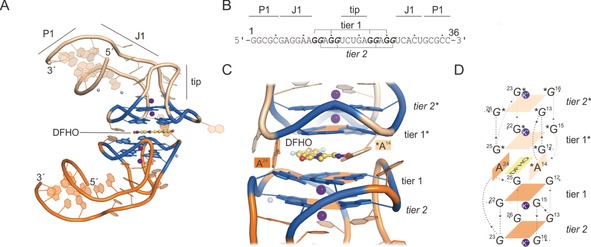
Figure 7.

Corn–DFHO crystal structure (PDB ID: 5bjo).71 A) Crystal structure of Corn; names of structural features are indicated. Orange=aptamer A; light orange=aptamer B of the homodimer complex; purple spheres=Mg2+ and K+ ions; blue colored region=DFHO‐binding region including G‐quadruplex. B) Sequence of the crystallized Corn sequence by Warner et al.71 Bold=G‐quadruplex‐forming nucleotides. C) Close‐up of the fluorogen‐binding region. G‐quadruplex tiers are shown, and shaped platforms are indicated by orange planes. Each plane coordinates a potassium ion (purple). DFHO is shown in addition to its flanking nucleotides A24 of aptamer one and A14* of the second aptamer copy. D) Schematic overview of Corn–DFHO binding region. Numbers indicate the nucleotide numbers according to (B).
