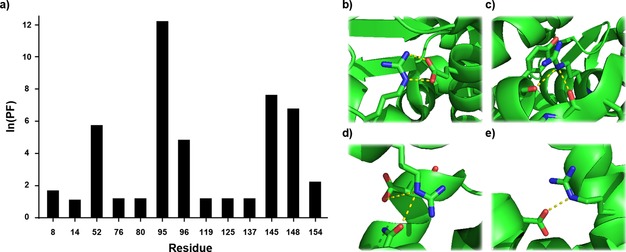
Figure 6.

a) Quantification of the interactions formed by the arginine side‐chains in T4 L. Crystal structures of b) R52, c) R96, d) R145 and e) R148 obtained from PDB:102 L. Exchange data for R95 was obtained as described in the Supporting Information.
