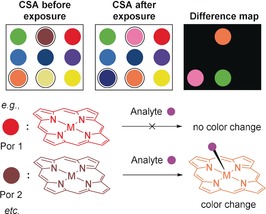
Figure 26.

Illustration of a CSA where each spot represents a different chemoresponsive dye (e.g., (metallo)porphyrins) before and after analyte exposure. Following testing, a difference map was generated. Some ligands showed a color change upon contact with the substrate.156
