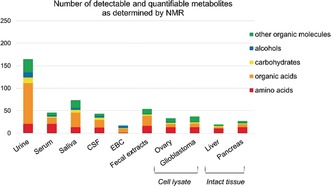
Figure 3.

Number of detectable and quantifiable metabolites with ≥50 % occurrence in the 1H NMR spectra of different biological fluids (urine,18 serum,19 saliva,20 CSF,21 EBC,22 fecal extracts, cell lysates (e.g. ovary and glioblastoma cells)23, 24 and intact tissues (e.g. liver and pancreas).25, 26
