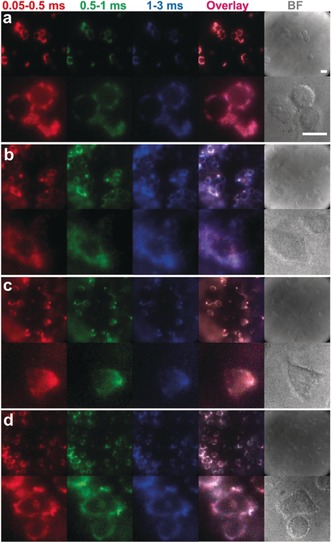
Figure 2.

TG PL images (top) and high‐resolution TG PL images (bottom) in different temporal detection windows (time ranges on top), their overlay, and bright field (BF) images of HeLa cells labeled with individual nanoparticle codes: a) Tb–QD/SiO2(6 nm); b) Tb–QD/SiO2(12 nm); c) Eu–QD/SiO2(6 nm); d) Eu–QD/SiO2(12 nm). Scale bar (top right): 20 μm; λ ex=349 nm; λ em=640 nm.
