Abstract
In this short critical perspective, we outline the serious problems caused by air pollution in Europe. Using two types of metrics, level assessment and trend assessment, we quantify the contribution of ammonia, NOx, SOx, non‐methane volatile organic compounds, and particulate matter in terms of years of life lost per capita and explain the connection between the various pollutants and their effects on human health and the environment. This is done on the basis of data collected by individual European Union (EU) member states as well as by the EU as a whole. We examine general emission trends as well as sector‐specific emissions and discuss the effectiveness of current legislation in reducing health risks and environmental damage. By combining these results with a cost–benefit analysis, we show that a further reduction in NOx emissions is the most urgent and potentially the most beneficial.
Keywords: environmental policy, health risk, nitrogen oxides, ozone, particulate matter
Introduction
Air pollution affects all of us. It is one of our greatest social and environmental problems, with terrible consequences. In 1952, a large cloud of sulfate aerosols covered London for just 2 days, yet killed about 12 000 people.1 More recently, a 5 day smog period in 1985 in North‐Rhine Westphalia put an estimated 4000 Germans in the hospital as a result of respiratory and cardiovascular failure.2 Unfortunately, these are not stand‐alone incidents. Even by conservative estimations, air pollution reduces the average life expectancy in Europe by nearly a year (a total of 7 million life years are lost annually).3 With the rise in urbanization, the dangers of air pollution are increasing. Identifying the problem is easy, but treating it is much harder because air pollution is highly complex. There are many types of pollutants, both anthropogenic and naturogenic. Moreover, quantifying the effects of specific pollutants is difficult because of periodical variations in pollution levels and correlation effects between pollutants.4 Choosing the right way to tackle air pollution is no mean task.
The European Union (EU) identifies seven main pollutants (excluding greenhouse gases, GHGs): ammonia (NH3), nitrogen oxides (NOx), carbon monoxide (CO), particulate matter (PM), sulfur dioxide (SO2), ozone, and non‐methane volatile organic compounds (NMVOCs). These pollutants have been under rigorous scrutiny since the 1980s, and their mitigation is in progress. Table 1 lists the main pollutants together with their cause, effects, and magnitude.
Table 1.
The seven main categories of air pollutants.[a]
| Pollutant | Chemical formula | Cause | Main effect | Magnitude [Mt] |
|---|---|---|---|---|
| ammonia | NH3 | agriculture | eutrophication | 3.9 |
| carbon monoxide | CO | commercial, institutional, and household fuel combustion | global warming | 21 |
| nitrogen oxides | NOx | transport and energy sectors | shortening of life expectancy acidification |
7.8 |
| non‐methane volatile organic compounds |
CnH2n+2 (n>1), CnH2n, CnH2n+1Cl, CnH2n+1OH |
industry | precursor to PM and ozone | 6.7 |
| ozone | O3 | NMVOCs, NOx | damage to crops | – |
| particulate matter5 | SO4
−2, NO3
−, NH4
+, C, CnH2n, CnH2n+2, Si, Na+ |
transport sector commercial, institutional, and residential |
shortening of life expectancy | 3.1 |
| sulfur dioxide | SO2 | energy sector | acidification | 3.1 |
[a] Output data estimate of EU28 based on fuel sold in 2014.6
Current efforts on curbing emissions are mainly directed towards ambient air concentrations as well as the introduction of ceilings to the total output. The main tools for pollution prevention and mitigation in Europe are provided by the Air Quality Directives (AQD) and the National Emission Ceilings Directive (NECD).7, 8, 9 However, emission ceilings were introduced under transatlantic agreements, whereof the so‐called Gothenburg Protocol is the latest. It has set ceilings for SO2, NOx, NMVOCs, and NH3 for 2010, 2020, and thereafter.10 Twenty‐six parties plus the EU have already ratified this agreement. Ambient air quality, however, remains solely under local governmental control, and ambitions differ significantly amongst members. The European Commission (EC) called in 2013 for a new Clean Air Policy Package (CAPP). This policy underlines current legislation up to 2020 and aims to improve air quality by hardening the stance on emissions cutbacks through 2030 and thereafter.11 Table 2 lists all the relevant EC/European Economic Community (EEC) legislations with their respective targets.
Table 2.
Air‐quality legislation in Europe.
| Legislation | Target |
|---|---|
| directive 2015/1480/EC | rules for reference methods, data validation, and sampling locations defined |
| directive 2008/50/EC | PM2.5 three (PM10), and five years (NO2, benzene) delayed compliance limit value |
| directive 2004/107/EC | As, Cd, Hg, Ni, aromatics |
| commission decision 2004/461/EC | annual reporting questionnaire |
| commission decision 2004/224/EC | obligated submission of plans and programs for threshold zones |
| directive 2002/3/EC | ozone |
| directive 2000/69/EC | limit values of benzene and CO |
| council directive 1999/30/EC | limit values of SO2, NOx, PM, and Pb |
| council decision 1997/101/EC | reciprocal data sharing |
| council directive 1996/62/EC | assessment and management |
| council directive 1985/203/EEC | air‐quality standards NO2 |
| council directive 1980/779/EEC | limit values of SO2 and PM |
Ideally, we should strive for a completely pollution‐free environment. Pragmatically, we must make some compromises. Quantifying and understanding emission data is the key for determining which pollutants should be targeted to maximize the benefits of emission‐reduction programs. A pollutant can be highly toxic, but if its total output and thereby the exposure of the public is limited, the relative benefits of fighting it are small. The selection can be done by analyzing the emission data of individual states and the EU as a whole. Data of all members of the Convention on Long‐Range Transboundary Air Pollution have been accumulated by the United Nations Economic Commission for the EU. Here, we quantify the risks air pollution poses to public health and the damage it causes to the environment. We study emission trends and determine the effectiveness of current legislation. Finally, we analyze the total output of EU member states, highlighting through a cost–benefit analysis (CBA) those pollutants and sectors for which gains can be maximized.
Level Assessment and Trend Assessment
There are two ways to analyze the impact of legislation on the abatement of a particular pollutant. The first reviews the change in the overall output within a certain period. The most recent data is compared to the base year (the earliest data available), is followed over time, and is then related to abatement efforts. In addition, the total output can be separated into specific sectors, and the relative contribution of a specific sector over time can be analyzed. This is known as level assessment. It enables the selection of those sectors that contribute most to air pollution in a particular year. The sectors that together contribute >80 % of the level in a specific year should then be the focus of additional abatement efforts.12 Level assessment is done by using Equation (1):
| (1) |
in which L x,t is the level assessment for source x in the latest inventory year t, E x,t is the value of emissions estimate of source category x in year t, and ΣEt is the total contribution in year t.
The second approach is so‐called trend assessment. Consider a situation in which the average pollutant output is declining, but one small sector shows a steep increase. This indicates either increasing activity in that particular sector, or that abatement efforts are ineffective in that specific sector. Such sectors can be identified by weighing the trend of a specific sector versus the trend of the total inventory. This trend assessment [Eq. (2)] pinpoints those sectors with the largest divergence from the overall trend of the inventory.12
| (2) |
in which T x,t is the trend assessment of source category x in year t compared to the base year, E x,0 and E x,t are the source estimates in year t and the base year, and ΣEt and ΣE 0 are the sums of the estimates of all the sources at year t and 0, respectively.
Throughout this paper, we use the terms trend assessment and level assessment to analyze and explain the emission data.
Regulated Pollutants and Their Sources
We classify pollutants as either primary or secondary. Primary pollutants are released directly to the atmosphere, whereas secondary ones form from precursor gases. All precursor gases are primary pollutants, but not all composed particles are secondary pollutants.
The most common primary pollutants include PM, CO, NMVOCs, NH3, NOx, and SOx (which represent whole families of nitrogen and sulfur oxides, respectively), and black carbon (BC).13 Their sources vary by geographical origin, year, and pollutant, but the key culprit sectors are energy, industry, and transport (ammonia is the exception, coming chiefly from the agricultural sector).
As the mode of action of specific pollutants often differs, we considered a classification system that distinguishes pollutants that directly impact the environment and human health from those with indirect impact. Some pollutants, such as NMVOCs, are not directly harmful but react in the atmosphere to give harmful products (in this case, ozone). Their impact, thus, depends both on their source and on the meteorological conditions. By including primary and secondary factors, we improve the accuracy and relevance of our risk assessment.
Composite particulate matter (PM2.5: diameter <2.5 μm; PM10: diameter 2.5–10 μm) is directly linked to asthma, eye and lung problems, and premature death. It can be emitted directly into the air and can be formed in the atmosphere. These particles are multicomponent aggregates, comprising a wide range of substances. In its primary definition, the main sources are car exhaust and road and tire wear. Yet PM has many other sources, both anthropogenic and naturogenic. The main precursor gases that lead to PM formation are NOx (36 %), NMVOCs (31 %), NH3 (18 %), and SO2 (15 %, see discussion below and details in the Supporting Information).
Secondary pollutants, next to PM, are ozone and the NO2 formed from the oxidation of nitrogen monoxide. Ozone forms in the atmosphere as a byproduct of the photochemical oxidation of NMVOCs by nitrogen oxides and ultraviolet (UV) light. Note that only tropospheric ozone is considered an air pollutant, as there it can inflict damage to plants, forests, and crops through oxidation reactions and do harm to humans through breathing.14, 15 Especially in areas with dry climates, such as the Mediterranean, ozone can wreak havoc in agriculture during the summer. Ozone is a peculiar pollutant, as its levels peak in bright sunshine and plummet under cloudy skies owing to its dependence on UV light.
SOx and NOx are not only primary pollutants but also key components of composite PM. These gases can react with oxygen in the air to form aerosols that build up to acid rain. Acid rain posed a serious environmental problem in the 1980s and 1990s, as it caused damage to large areas of agricultural land and ecosystems across Europe.16 It caused health problems as well, mainly as a result of respiratory tract inflammation.17 A large UK study showed that sulfate ions accounted for 30–35 % of the make‐up of PM. Nitrate salts—formed upon binding of acidic nitrogen oxides to sodium or ammonium ions—accounted for a further 25 %.18 The emission of both gases and especially of SO2 was subsequently strictly regulated.7, 8 As a result, the levels of both compounds have dropped significantly in the past decade. However, there are increased concerns about the effects of NOx on human health as a primary pollutant. It is associated with premature death, a higher number of hospitalizations due to acute respiratory failure, and longer hospitalization periods. On top of that, exposure to NOx increases the risk of chronic respiratory diseases, especially among children.19, 20, 21
Contribution by Volume
Examining the emissions in 2014, we see that CO is the largest contributor. With a staggering total output of 21 megatons, it accounts for about half of the output of all seven pollutants combined (Figure 1, left). However, the direct risk that atmospheric CO poses to health is limited and, therefore, of minor concern to policy makers (it only poses a significant risk to public health in cases of high exposure rates for long periods22). Out of 39 EEA member and cooperating states, only 1 operational station reported CO levels exceeding the World Health Organization (WHO) Air Quality Guideline (AQG) limit in 2013. Thus, we decided to exclude CO emission data, as this would benefit the weight attribution to the remaining pollutants and the research as a whole (CO may still pose a threat as a greenhouse gas, but this is out of the scope of our study).
Figure 1.
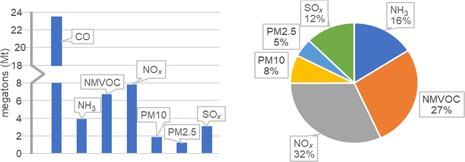
Column graph showing the estimated emissions in megatons of pollutants in the EU28 in 2014 (left) and pie chart showing the corresponding vol % contribution of each pollutant if CO is excluded (right). Data is based on the amount of fuel sold in 2014.6
The remaining two largest contributors by volume are NOx and NMVOCs. Together, they make up almost two‐thirds of the share of the total output of air pollutants (Figure 1, right). That said, although PM accounts for only 13 %, it is a strong threat because of its associated adverse health effects. Given that PM is a composite, we treat the share of each component separately. Again, we see that NMVOCs and NOx are the largest. Consequently, combating the emission of these pollutants would reduce PM emissions substantially and would also improve overall air quality. However, we still do not understand how the chemical composition of PM affects the potency of the adverse health effects associated with its exposure.23 Although SOx and NH3 play minor roles if solely their total output is taken into account, their relative effect may still be stronger if their toxicity is more significant. To judge the importance of these chemicals, we assess their impact on public health and environment and run a trend assessment (see below).
Health Risks
The health risks of PM have until recently masked the specific risks associated with NO2. Given that both pollutants are by and large byproducts of combustion processes, their effects are correlated and are usually quantified together.24 However, increasing evidence shows that NO2 itself poses a health risk. Since 2015, the EEA has included NO2 in its multipollutant model study, linking increased morbidity to ambient air NO2 concentrations.3, 22 The impact of NO2 is four times larger than that of ozone, yet still six times smaller than that of PM. In 2013, an estimate of 723 000 years of life were lost (YLLs) in the EU28 (Table 3) (YLL=weighted average of life years lost compared to life expectancy of a demographic group), with the largest impact observed in Italy.3
Table 3.
Years of life lost due to main air pollutants in the EU28 in 2013 and their associated reduction in life span per capita.3
| PM2.5 | NO2 | O3 | |||
|---|---|---|---|---|---|
| total YLL | per capita | total YLL | per capita | total YLL | per capita |
| 4 668 000 | −8 months | 723 000 | −1 month | 179 000 | −1 week |
These estimates are conservative, because the WHO guideline for the onset of adverse effects for NO2 ambient air concentrations is 20 μg m−3. Correlations between morbidity and NO2 concentrations are now only modeled for concentrations exceeding this threshold. Consequently, the current model underestimates the impact of NO2 on public health, because today we know that the threshold should be lower. A comparison of the impact of different legislations on the decline in ambient air pollution levels with the occurrence of premature deaths can influence policy makers to choose one goal over another. As largest gains in workforce could be achieved for PM2.5, we considered four different EEA scenarios, ranked from conservative to most optimistic:
Scenario A: The annual EU limit value of 25 μg m−3 is met
Scenario B: The WHO 3 year average exposure concentration limit of 20 μg m−3 is met
Scenario C: The country‐specific emission reduction targets (ranging from 0 to 20 %) are met
Scenario D: The annual WHO AQG of 10 μg m−3 is met
Each scenario showed gains in life expectancy with the most optimistic one showing major gains throughout the EU (Figure 2). However, scenario A showed only limited gains, which could be explained by the fact that the EU limit value was only exceeded in 9 % of the stations in 2013, and thus, attaining this limit by 2015 would not give much benefit.22
Figure 2.
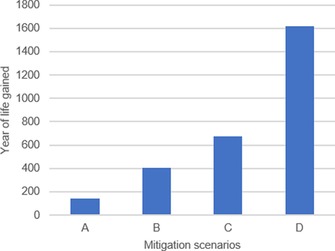
Total number of years of life gained in the EU in each of the forecast scenarios A–D impacting the emission of PM2.5.
Interestingly, the current effect of the ambient (outdoor) air concentration limit of NO2 (40 μg m−3), the only legislation in effect, outweighs the effect of the impact of scenario A for the curbing of PM2.5 emissions by >25 %. This suggests that if the NO2 WHO limit value is met, which was exceeded in 14 % of the operational stations across Europe, it would outperform the attainment of PM2.5, which is significantly lower. It also highlights the cost effectiveness of NO2 legislation, even on short timescales. Achieving even the “softest” scenario for NO2 would still outperform the morbidity gains of PM reduction.
An increased relative risk (RR) of hospital admissions as a result of respiratory problems is correlated with short‐term exposure to ambient NO2 concentrations.25 For a 24 h average exposure, the RR of hospitalization due to respiratory disease increased by 1.56 % per 10 μg m−3 NO2. Specifically, hospitalization due to asthma amongst children (aged 5 to 14) showed increased risks (2.45 % per 10 μg m−3 NO2). The latest data for respiratory disease hospitalization showed an average 8.5 days admission and an incidence rate of 1165 per 100 000 inhabitants (Table 4).
Table 4.
Respiratory‐related hospitalization in 26 EU countries from 2005 to 2011.
| Respiratory‐related hospital admissions, all ages |
Average stay length [days] |
Cases per 10 0000 |
|---|---|---|
| average | 8.5 | 1165 |
| minimum | 4.5 | 528 |
| maximum | 14.5 | 2170 |
The length of hospitalization and YLLs are a measurable quantity of loss of workforce. They can be included in a CBA for abatement policies. However, owing to fears of double counting, healthcare costs of NO2 exposure have not been included in the latest CBAs of the CAPP, nor were they included in the implementations of the recommendations of the Health Risks of Air Pollution in Europe project.26, 27 Although the EEA had confidence in the robustness of the YLLs as a result of long‐term exposure to NO2, it has yet to be included in CBAs. Up to 33 % of the adverse effects of NO2 are included in the quantification of particulate matter.28 This implies, however, that two thirds of the additional healthcare cost is being neglected as a direct result of the underestimation of these adverse effects. A striking example of the directness of impact on health of NO2 mitigation is the case study of the Beijing 2008 Olympic Games, for which the concentration dropped by 43 % in the same year as a result of abatement. This sudden decrease in ambient air concentrations was directly linked to improvement in cardiovascular disease markers.29
Environmental Damage
Air quality has multiple effects on our environment. For example, a rising ground‐level ozone concentration can lower the yield of agricultural crops and damage vegetation by decreasing growth rates. Other pollutants, such as NOx, SOx, and NH3, contribute to the acidification of soil and groundwater. Ammonia can counter acidification, but together with NOx it causes eutrophication. The excess nutrient build up on the earth's surface impairs biodiversity and facilitates the invasion of alien species. Eutrophication has a large impact: in 2012, 63 % of EU28 member states’ ecosystems were under immediate risk of eutrophication, and 73 % of the 2000 EU Natura Area was exposed to it.30 The risk of eutrophication is measured as an exceedance of a critical load (CL), a limit value set to represent the amount of excess nutrients an ecosystem can manage without significant changes to its diversity.31
For acidification, the CL is determined as the maximum decrease in pH a particular system can sustain. Since 2005, the risk of acidification of the ecosystems of the EU28 has declined by 40 %, and the risk to the EU 2000 Natura Area has decreased by 30 %. This is attributed to a decline in SO2 levels over the past decades. As a result, NOx and NH3 have become the largest influencers in acidification throughout Europe. Moreover, NH3 output has declined only marginally since 2000. Unfortunately, quantifying the risks of eutrophication and acidification is difficult, as assigning values to the biodiversity and the sustainability of ecosystems is impractical. Measures, however, were taken to battle these phenomena. For instance, annual critical levels of NOx and SO2 for the protection of vegetation in rural areas were set as 30 and 2 μg m−3, respectively.
Conversely, ozone is directly linked to damage to agricultural crops and is, therefore, included in cost estimates. A 2011 study calculated a €3.2 billion loss in wheat production in the EU27 plus Norway and Switzerland in 2000 solely through damage caused by ground‐level ozone.32 Unfortunately, concentrations depend on multiple factors: volume fractions of NO, NO2, and NMVOCs as well as the levels of sunshine. This makes it difficult to pinpoint a measure that benefits agricultural yield the most. Therefore, a more generalized legislation is in place, targeting each component individually. This includes the annual limit level of NOx and reduction targets for NMVOCs.
General Emission Trends
Since the implementation of the NECD and the AQDs, ground‐level concentrations of almost all pollutants have declined steadily (Figure 3).7, 8, 9 The two most notable trends concerning emission reduction are the decline of SOx levels and the almost unchanged total output of ammonia. The total output of SOx for the EU28 member states decreased by 69 % in the period of 2000 to 2014, following the implementation of the EU AQDs. Similarly, NMVOC emissions were cut by 39 % (see the Supporting Information for more details).
Figure 3.
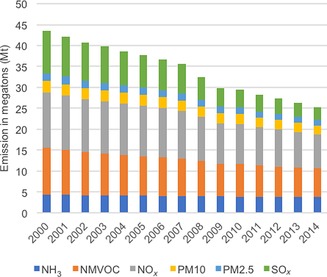
Emission trends in the EU28 on the basis of fuel sold.6
The marginal decline in NH3 can be understood by considering its main source: in 2010, 94 % of the ammonia emissions originated from agriculture.30 The decline can mostly be attributed to the local decrease in the number of livestock, as manure management is the largest contributor to NH3 release. Next to that, optimization of the use of nitrogen‐containing fertilizers should be assigned to the remainder of the reduction (some fertilizer is always needed, as it directly affects production capacity).
Our level assessment points out seven sectors that had a considerable influence on the total output in 2014 (Figure 4). All the key categories are in the agricultural sector and are of manure‐management origin, with the exception of the chief contributor. With a 21 % total share, the distribution of inorganic nitrogen fertilizers had the largest impact on the environmental state if NH3 was considered.
Figure 4.
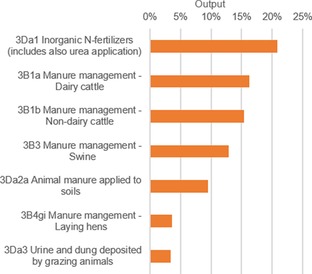
Level assessment of relative sector output of NH3 in 2014. The sum of the contributions adds up to 80 % of the total output.
Both PM2.5 and PM10 declined by about a quarter between 2000 and 2014 (Figure 3). The gains were mostly achieved in the energy sector owing to switching from coal‐powered plants to natural gas (Figure 5). The most polluting sector was the residential stationary combustion sector, with a 51 % share for PM2.5 and a 36 % share for PM10 in 2014. Many additional small sectors are required to reach the total of 80 % for level assessment.
Figure 5.
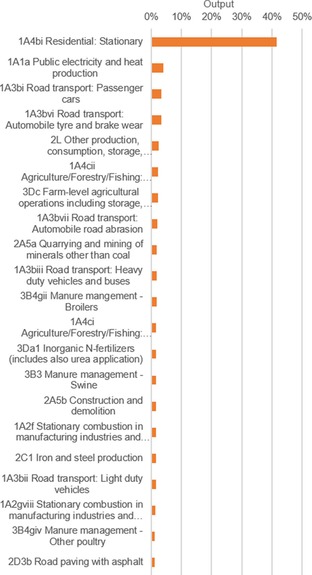
Level assessment of the relative sector output of PM2.5 and PM10 in 2014. The sum of the contributions adds up to 80 % of the total output.
If we compare the share to the total output in 2014 to that of 2000, we see an increase in contributions of 41 and 36 %, again emphasizing the importance of this single sector. Furthermore, upon comparing the emission data of Germany with that of a new EU member state such as Romania, we see that large gains can still be made with the measures currently in place. Romania had only a 30 % smaller total PM10 output in 2014 than Germany, whereas it had a 75 % smaller population.33 Even more so, it had a larger PM2.5 output of 11.5 kilotons. Germany reduced its output from 2000 to 2014 with 34 % for PM2.5 and 20 % for PM10.
Our analysis shows that the trend in emissions for this sector declined by 19 % for PM10, indicating that further legislation for this sector is less practical. However, for PM2.5 a growth in trend of 37 % was measured. Clearly, large gains are still possible in that sector. Gains in the residential combustion sector for both PM pollutants are expected in the younger member states, for which mitigation efforts are still underway. However, gains in PM10 reduction overall are expected to decline. Only one other large sector exists for this pollutant (the energy sector), and only small gains were reported there. The gains that were achieved originated from the aggregated reduction of emission of a larger group of smaller polluters.
NOx emissions declined by 39 % with the largest gain in the transportation sector as a result of the advent of cleaner fuels and better combustion techniques (Figure 3). The main polluting sector is still “Road transport: passenger cars”. In 2014, it contributed 18 % of the total NOx release of the EU28 (Figure 6). Other polluting sectors are “Public electricity and heat production” (17 %) and “Road transport: Heavy‐duty vehicles and buses” (16 %).
Figure 6.
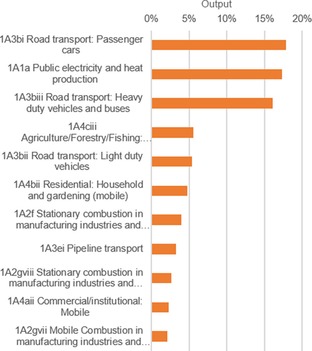
Level assessment of NOx emissions in the EU28 in 2014: 11 categories were identified as key by standards of the EEA (sum contributions larger than 80 %).
Sector‐Specific Effectiveness
Here, we used a trend assessment to study the effectiveness of the current legislation on curbing emissions in specific sectors. We identified two sectors that had the largest deviation from the overall trend of the inventory, both pertaining to road transport. “Road transport: Heavy‐duty vehicles and buses” declined by 22 %, and “Road transport: passenger cars” decreased by 15 %. Bearing in mind that these sectors contribute a fair share to the total output of NOx (Figure 7), this raises a red flag for the total decline in the impact of mitigation efforts on the reduction of NOx in the road‐transportation sector. The total emissions declined by 31 %. This supports our assumption that the impact of reduction measures is reaching its limits.
Figure 7.
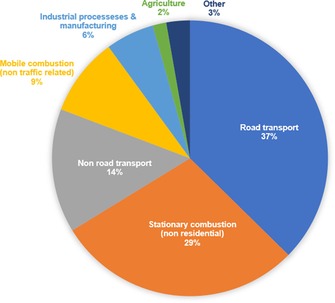
Aggregation of sectors contributing to the total NOx output of the EU28 in 2014 to identify the most significant polluters (in this case, “Road transport and Stationary combustion”).
Conversely, stationary combustion showed a strong increase in its contribution to the total. Here, five sectors were indicated as key, of which four were of the nonresidential type. The aggregate had a total contribution to NOx release of 29 % and showed an increase in trend of 11 %. These results show that large gains are still achievable in this sector. Stricter regulation of these sectors is desirable.
The Cost Effectiveness of Emission Reduction
Cost–benefit analyses are used by policy makers to measure the effectiveness of future legislation. They consider economic activity, costs of emission reduction, and adverse effects of air pollution and try to determine the most cost‐effective measure to attain a goal. One model that is widely used here is the Greenhouse Gas and Air Pollution Interactions and Synergy (GAINS) model. This model includes impacts on human health by PM and ground‐level ozone, acidification and eutrophication of ecosystems, and effects of GHG mitigation, correlating these to national emission estimates of the main air pollutants (SO2, NOx, PM, NMVOCs, CO2, NH3, CO, CH4, N2O, and fluoride‐containing gases).34 GAINS relates the effects of a baseline to that of increasingly tighter emission control target packages, up to the maximum technically feasible reduction (MTFR) scenario.
Amann et al. studied such scenarios.35 They examined the emission reduction goals for 2020, set in the Gothenburg Protocol, highlighting the most cost‐effective revisions of these measures. With the 2011 legislation as a baseline, they estimated an average of 4.3 months shorter life expectancy per capita for 2020 throughout the EU27 as a direct result of PM exposure (equivalent to 120 million YLLs). In addition, they projected 24 000 new cases of premature deaths per year due to ground‐level ozone exposure, an immediate eutrophication threat to 1.4 million km2 of European ecosystems, and unsustainable pH levels in 110 000 km2 of forest. These results show the need for new legislative measures that can target emissions.
After establishing the baseline, they carried out a gap‐closure procedure, calculating the effects of various legislation packages in a stepwise fashion. Each new set of legislative measures results in a different reflection of the cost effectiveness of that collection of abatement efforts. By tweaking the relative ratios of each of the impact indicators, an optimal reduction package was selected. Whereas the suggestion of a set of reduction targets is beyond the scope of this research, we studied the sensitivity analysis of each individual impact indicator to help select such a package.
By choosing an arbitrary gap closure scenario for the impact indicators, that is, health effects, acidification, eutrophication, and ground‐level ozone, a sensitivity analysis made clear that mitigation costs for ozone were most sensitive towards gap‐closure ambitions. For example, if the gap closure targets were increased by 20 % on top of an arbitrary overall gap‐closure setting of 25 %, ozone reduction costs increased by roughly 60 % (Figure 8). Eutrophication was shown to be the least sensitive, as costs grew marginally if targets were tightened. A 20 % tighter target resulted in a growth of about 20 %, showing the near linearity of the impact response curve at lower impact levels for eutrophication.
Figure 8.
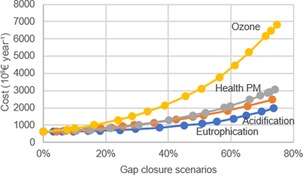
Sensitivity analysis of impact indicators considering four gap‐closure scenarios. For each scenario, the gap‐closure target was increased up to 70 % and the growth in costs was estimated while all other impact indicators were kept at a constant value of 25 %. Data redrawn from Ref. 35.
Ground‐level ozone concentrations are cut through the reduction of NMVOCs and NOx, and eutrophication reduction is achieved through mitigation of NH3 and NOx, providing an opportunity. To reach the beneficiary effects of ozone reduction, sizeable investments are needed to reduce the concentrations of both NMVOC and NOx. Fortunately, owing to the insensitivity of eutrophication reduction, the minimization of ammonia mitigation could counter the additional costs of NOx reduction. The costs of a relatively higher ammonia output are only marginal compared to those of NOx.
Another cost–benefit analysis by Van Grinsven et al. quantified nitrogen mitigation in Europe as guidance for policy makers to prioritize particular legislation.36 Using standard economic concepts such as estimations of cost of treatment, workdays lost, and willingness to pay to reduce YLLs, they estimated that the EU27 spent between €100 and 300 billion in 2008 on costs related to NOx emissions. For sources of stationary combustion, legislative measures would especially be beneficial, up to 10–20 % reduction of the prognoses of emission levels in 2020. This is a strong argument for NOx mitigation legislation for short‐term targets. However, for more strict emission reduction targets to be cost effective (cutting emissions by 360 kt and beyond), technological innovations are needed.
Summary and Outlook
A pollutant's impact must be measured by two criteria. First, the emission should be sizeable. Pollutants may be toxic to humans or bad for the environment, but if their exposure is low, so is their impact. Second, both direct and indirect effects should be considered. Yet even if a pollutant fulfils both requirements, stricter measures may not be needed, so long as current legislation has led to significant risk reduction. However, if the measures prove ineffective, or if the risk was underestimated, additional measures should be applied. The final criterion is cost effectiveness. Emission control legislations will only be passed by governments that perceive them as cost effective.
Specifically, we conclude that further reduction in NOx emissions is the most urgent and most beneficial. By improving ambient air quality, NOx abatement will benefit both the public and the environment. As the technology required for NOx reduction advances, the gains in workforce and healthcare savings from NOx abatement will outweigh the costs of implementation.
Conflict of interest
The authors declare no conflict of interest.
Supporting information
As a service to our authors and readers, this journal provides supporting information supplied by the authors. Such materials are peer reviewed and may be re‐organized for online delivery, but are not copy‐edited or typeset. Technical support issues arising from supporting information (other than missing files) should be addressed to the authors.
Supplementary
Acknowledgements
This research is part of the Research Priority Area Sustainable Chemistry of the UvA, http://suschem.uva.nl
C. D. Koolen, G. Rothenberg, ChemSusChem 2019, 12, 164.
Contributor Information
Cedric D. Koolen, http://hims.uva.nl/hcsc
Prof. Dr. Gadi Rothenberg, Email: g.rothenberg@uva.nl.
References
- 1. Wang G., Zhang R., Gomez M. E., Yang L., Levy Zamora M., Hu M., Lin Y., Peng J., Guo S., Meng J., Li J., Cheng C., Hu T., Ren Y., Wang Y., Gao J., Cao J., An Z., Zhou W., Li G., Wang J., Tian P., Marrero-Ortiz W., Secrest J., Du Z., Zheng J., Shang D., Zeng L., Shao M., Wang W., Huang Y., Wang Y., Zhu Y., Li Y., Hu J., Pan B., Cai L., Cheng Y., Ji Y., Zhang F., Rosenfeld D., Liss P. S., Duce R. A., Kolb C. E., Molina M. J., Proc. Natl. Acad. Sci. USA 2016, 113, 13630–13635. [DOI] [PMC free article] [PubMed] [Google Scholar]
- 2. Wichmann H. E., Mueller W., Allhoff P., Beckmann M., Bocter N., Csicsaky M. J., Jung M., Molik B., Schoeneberg G., Environ. Health Perspect. 1989, 79, 89–99. [DOI] [PMC free article] [PubMed] [Google Scholar]
- 3.“Air Quality in Europe–2016 Report” can be found under https://www.eea.europa.eu/publications/air-quality-in-europe-2016.
- 4. Mauderly J. L., Samet J. M., Environ. Health Perspect. 2009, 117, 1–6. [DOI] [PMC free article] [PubMed] [Google Scholar]
- 5. Dominici F., Wang Y., Correia A. W., Ezzati M., Pope C. A., Dockery D. W., Epidemiol. Camb. Mass 2015, 26, 556–564. [DOI] [PMC free article] [PubMed] [Google Scholar]
- 6.“National Emissions Reported to the Convention on Long-Range Transboundary Air Pollution (LRTAP Convention)” can be found under https://www.eea.europa.eu/data-and-maps/data/national-emissions-reported-to-the-convention-on-long-range-transboundary-air-pollution-lrtap-convention-11.
- 7.Directive 2004/107/EC of the European Parliament and the Council of 15 December 2004 Relating to Arsenic, Cadmium, Mercury, Nickel, and Polycyclic Aromatic Hydrocarbons in Ambient Air, 2005.
- 8.Directive 2008/50/EC of the European Parliament and the Council of 21 May 2008 on Ambient Air Quality and Cleaner Air for Europe, 2008.
- 9.Directive 2001/81/EC of the European Parliament and the Council of 23 October 2001 on National Emission Ceilings for Certain Atmospheric Pollutants, 2001.
- 10.“Gothenburg Protocol–Air Pollution–Environmental Policy–UNECE” can be found under http://www.unece.org/environmental-policy/conventions/air/guidance-documents-and-other-methodological-materials/gothenburg-protocol.html.
- 11.“European Commission–PRESS RELEASES–Press Release–Environment: New Policy Package To Clean up Europe's Air” can be found under http://europa.eu/rapid/press-release_IP-13-1274_en.html.
- 12.“EMEP/EEA Air Pollutant Emission Inventory Guidebook–2016” can be found under https://www.eea.europa.eu/publications/emep-eea-guidebook-2016.
- 13. Long C. M., Nascarella M. A., Valberg P. A., Environ. Pollut. 2013, 181, 271–286. [DOI] [PubMed] [Google Scholar]
- 14. Jenkins H. S., Devalia J. L., Mister R. L., Bevan A. M., Rusznak C., Davies R. J., Am. J. Respir. Crit. Care Med. 1999, 160, 33–39. [DOI] [PubMed] [Google Scholar]
- 15. Wilkinson S., Mills G., Illidge R., Davies W. J., J. Exp. Bot. 2012, 63, 527–536. [DOI] [PubMed] [Google Scholar]
- 16. Pollutants in Porous Media: The Unsaturated Zone between Soil Surface and Groundwater (Eds.: B. Yaron, G. Dagan, J. Goldshmid), Springer, Berlin, 1984. [Google Scholar]
- 17. Kleinman M. T., Phalen R. F., Mautz W. J., Mannix R. C., McClure T. R., Crocker T. T., Environ. Health Perspect. 1989, 79, 137–145. [DOI] [PMC free article] [PubMed] [Google Scholar]
- 18.R. M. Harrison, B. Brimblecombe, R. G. Derwent, G. J. Dollard, S. Eggleston, R. S. Hamilton, A. J. Hickman, C. Holman, D. P. H. Laxen, S. Moorcroft, Department of the Environment, “Particulate Matter in the United Kingdom” can be found under https://uk-air.defra.gov.uk/library/reports?report id=48 can be found under https://uk-air.defra.gov.uk/library/reports?report_id=48.
- 19. Stockfelt L., Andersson E. M., Molnár P., Rosengren A., Wilhelmsen L., Sallsten G., Barregard L., Environ. Res. 2015, 142, 197–206. [DOI] [PubMed] [Google Scholar]
- 20. Hoek G., Krishnan R. M., Beelen R., Peters A., Ostro B., Brunekreef B., Kaufman J. D., Environ. Health 2013, 12, 43. [DOI] [PMC free article] [PubMed] [Google Scholar]
- 21. Cesaroni G., Badaloni C., Gariazzo C., Stafoggia M., Sozzi R., Davoli M., Forastiere F., Environ. Health Perspect. 2013, 121, 324–331. [DOI] [PMC free article] [PubMed] [Google Scholar]
- 22.“Air Quality in Europe–2015 Report” can be found under https://www.eea.europa.eu/publications/air-quality-in-europe-2015.
- 23. Hampel R., Peters A., Beelen R., Brunekreef B., Cyrys J., de Faire U., de Hoogh K., Fuks K., Hoffmann B., Hüls A., Imboden M., Jedynska A., Kooter I., Koenig W., Künzli N., Leander K., Magnusson P., Männistö S., Penell J., Pershagen G., Phuleria H., Probst-Hensch N., Pundt N., Schaffner E., Schikowski T., Sugiri D., Tiitanen P., Tsai M. Y., Wang M., Wolk K., Lanki T., Environ. Int. 2015, 82, 76–84. [DOI] [PubMed] [Google Scholar]
- 24. Hart J. E., Garshick E., Dockery D. W., Smith T. J., Ryan L., Laden F., Am. J. Respir. Crit. Care Med. 2011, 183, 73–78. [DOI] [PMC free article] [PubMed] [Google Scholar]
- 25. Anderson H. R., Gupta R., Strachan D. P., Thorax 2007, 62, 85–90. [DOI] [PMC free article] [PubMed] [Google Scholar]
- 26.“Implementation of the HRAPIE Recommendations for European Air Pollution CBA Work” can be found under http://ec.europa.eu/environment/air/pdf/CBA%20HRAPIE%20implement.pdf.
- 27.“Cost–Benefit Analysis of Final Policy Scenarios for the EU Clean Air Package” can be found under http://ec.europa.eu/environment/air/pdf/TSAP%20CBA.pdf, M. Holland.
- 28.“WHO/Europe–Air Quality–Health Risks of Air Pollution in Europe–HRAPIE Project, New Emerging Risks to Health from Air Pollution—Results from the Survey of Experts” can be found under http://www.euro.who.int/en/health-topics/environment-and-health/air-quality/publications/2013/health-risks-of-air-pollution-in-europe-hrapie-project.-new-emerging-risks-to-health-from-air-pollution-results-from-the-survey-of-experts.
- 29. Rich D. Q., Kipen H. M., Huang W., Wang G., Wang Y., Zhu P., Ohman-Strickland P., Hu M., Philipp C., Diehl S. R., Lu S. E., Tong J., Gong J., Thomas D., Zhu T., Zhang J. J., J. Am. Med. Assoc. 2012, 307, 2068–2078. [DOI] [PMC free article] [PubMed] [Google Scholar]
- 30.“Air Quality in Europe–2014 Report” can be found under https://www.eea.europa.eu/publications/air-quality-in-europe-2014.
- 31. Critical Loads and Dynamic Risk Assessments: Nitrogen, Acidity and Metals in Terrestrial and Aquatic Ecosystems (Eds.: W. de Vries, J.-P. Hettelingh, M. Posch), Springer, Netherlands, 2015. [Google Scholar]
- 32.H. Harmens, G. Mills, F. Hayes, K. Sharps, M. Frontasyeva, Air Pollution and Vegetation, ICP Vegetation Annual Report 2015/2016, 2016.
- 33.“Database–Eurostat” can be found under http://ec.europa.eu/eurostat/data/database.
- 34.“Air Quality and Greenhouse Gases (AIR)–Air Quality and Greenhouse Gases–IIASA” can be found under http://www.iiasa.ac.at/web/home/research/researchPrograms/air/Program-Overview.en.html.
- 35.M. Amann, I. Bertok, J. Borken-Kleefeld, J. Cofala, C. Heyes, L. Höglund-Isaksson, Z. Klimont, P. Rafaj, W. Schöpp, F. Wagner, “Cost-Effective Emission Reductions To Improve Air Quality in Europe in 2020: Analysis of Policy Options for the EU for the Revision of the Gothenburg Protocol” can be found under http://pure.iiasa.ac.at/id/eprint/9751/.
- 36. Van Grinsven H. J. M., Holland M., Jacobsen B. H., Klimont Z., Sutton M. A., Jaap Willems W., Environ. Sci. Technol. 2013, 47, 3571–3579. [DOI] [PubMed] [Google Scholar]
Associated Data
This section collects any data citations, data availability statements, or supplementary materials included in this article.
Supplementary Materials
As a service to our authors and readers, this journal provides supporting information supplied by the authors. Such materials are peer reviewed and may be re‐organized for online delivery, but are not copy‐edited or typeset. Technical support issues arising from supporting information (other than missing files) should be addressed to the authors.
Supplementary


