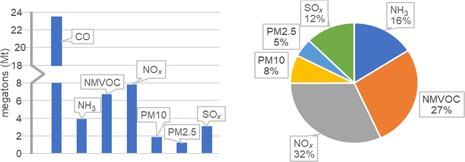
Figure 1.

Column graph showing the estimated emissions in megatons of pollutants in the EU28 in 2014 (left) and pie chart showing the corresponding vol % contribution of each pollutant if CO is excluded (right). Data is based on the amount of fuel sold in 2014.6
