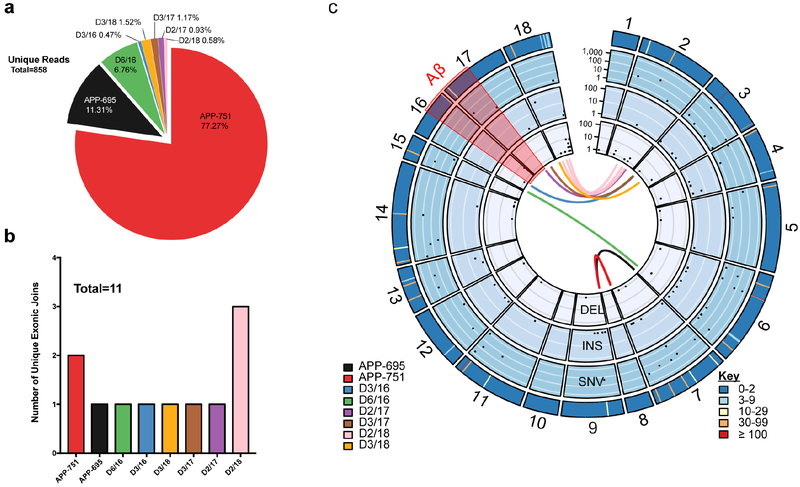
Extended Data Figure 5. Unique gencDNAs identified in non-diseased brain.
(a) Total number and proportion of unique reads from each identified IEJ form. (b) Number of unique IEJs forms. (c) A concentric circle plot of the APP locus (exon numbers along perimeter) depicting IEJs (connecting lines inside the circles), deletions (DEL) (first inner circle), insertions (INS) (second inner circle), and single nucleotide variations (SNVs) (third inner circle). Black dots indicate the abundance of DELs, INSs, and SNVs on a log(10) scale at the specified exon location. The outermost circle depicts the sum count (key) of unique changes. The Aβ region is highlighted in red.

