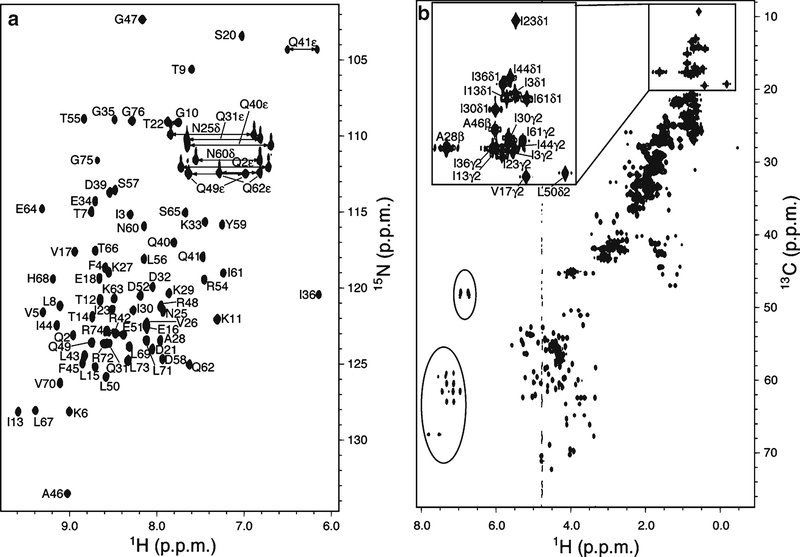
Fig. 1.
1H, 15N/ 13C correlation experiments for ubiquitin. (a) 1H, 15N HSQC spectrum of the distal subunit of K48-linked diubiquitin with its lysine at position 48 substituted with arginine. (b) 1H, 13C HMQC spectrum of the proximal subunit of K48-linked diubiquitin. Parameters for each spectrum are listed in Table 1. The resonances of 1H (a) or dispersed methyl groups (b) are labeled based on ubiquitin chemical shift data from BMRB Entry 6457 (http://www.bmrb.wisc.edu/). The circled resonances in (b) are from folded aromatic groups.

