
Figure 1. OCT Processing and Analysis.
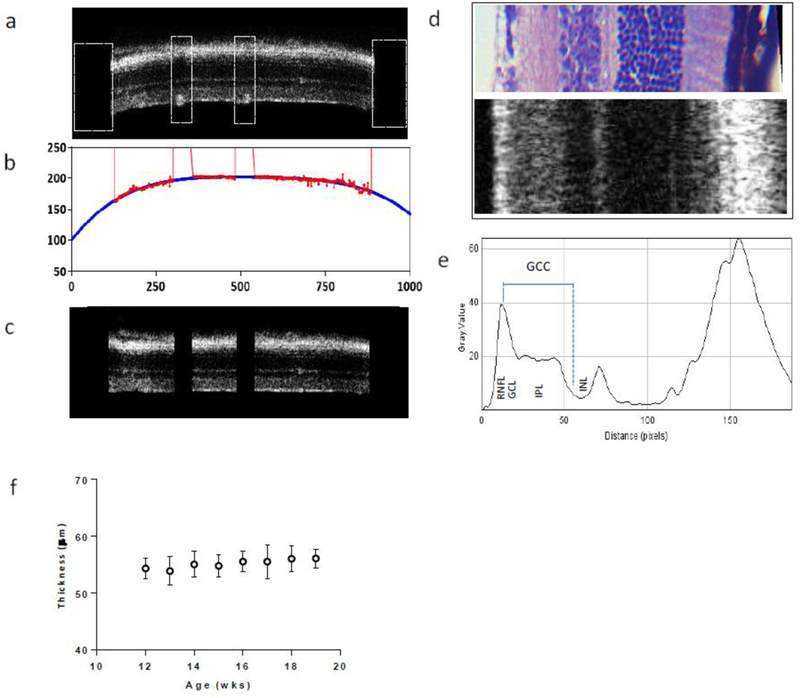
a. Selected B scans were preprocessed by manually removing segments containing vessels along the RNFL surface and trimming edges (white boxes) to aid subsequent processing steps. b. Processed B scans were analyzed using MATLAB which fit the surface of the RNFL/vitrius border (red) with a quadratic curve (blue). This curve was used to flatten the retina by shifting individual A scans to a common reference level (c). d. Portion of an H&E stained retina along with a section of flattened retina (rotated 90°) showing the correspondence between individual layers. e. Profile plot showing the average grey values of individual layers in the retina. The measurement of the GCC is shown in blue, extending from the peak RNFL value to the middle boundary between IPL and underlying INL. f. GCC thickness measures (mean ± SD) from 3 untreated, WT mice between 12–19 weeks of age.