
Figure 4. Optic Nerve DTI measurements.
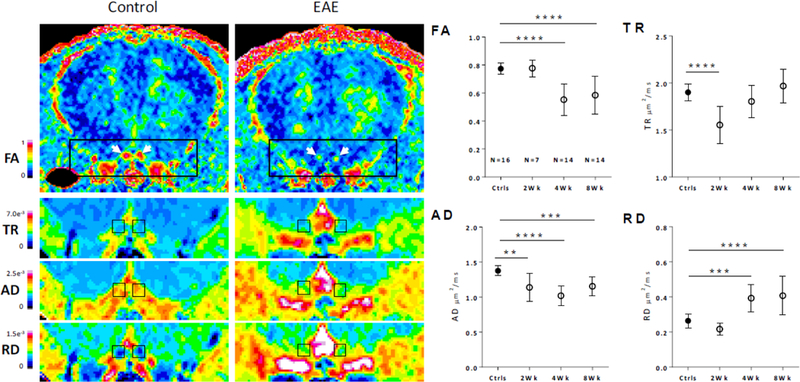
Left, pseudocolored representative images showing the diffusion changes in 8 week EAE mice relative to controls. Left and Right optic nerves are shown in coronal section and indicated by white arrows in FA maps. Diffusion maps for TR, AD and RD are shown in enlarged views below; ON ROIs are shown in black boxes. Right, quantified ON diffusion changes across the time-course. **, p<0.01, ***, P<0.001, ****, p<0.0001