
Figure 6. Axon and myelin loss during EAE.
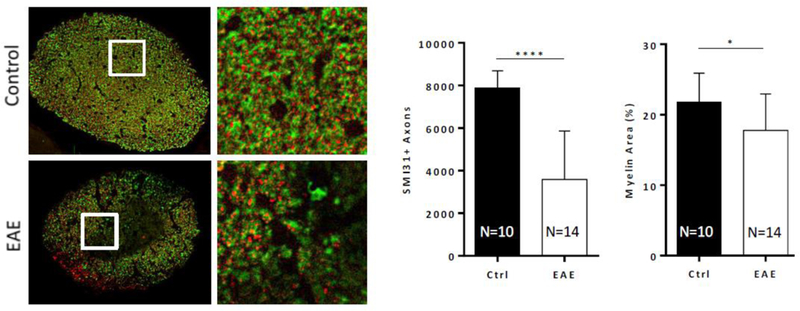
Left, axons and myelin labeled using SMI-31 (red) and MBP (green). EAE optic nerves show widespread demyelination and axonal loss, relative to controls. Right, quantification of axon and myelin loss. *, p<0.05; ****, p<0.0001