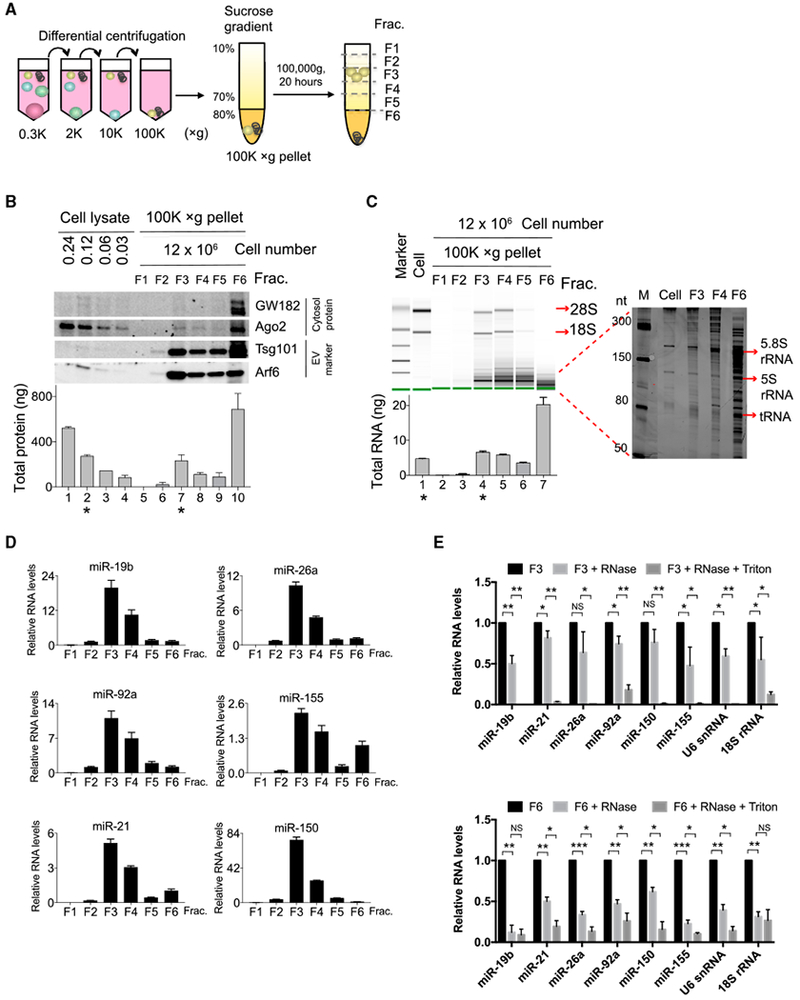
Figure 1. EVs that Contain Intact Discrete RNA Species Are Separated from Protein Aggregates that Are Dominated by Fragmented RNAs.

(A) Schematic of a two-step purification procedure for separation of EVs from aggregates in cell culture supernatant. The supernatant was first subjected to differential centrifugation to remove live cells, dead cells, cell debris, and, finally, EVs, and aggregates were precipitated into 100,000 × g pellets. The 100,000 × g pellets were further separated by sucrose gradient into 6 fractions.
(B) Western blot (top panel) analysis of sucrose gradient fractions of the separated 100,000 × g pellets and cell lysates prepared from the indicated numbers of cells in each lane. Bradford assay (bottom panel) determined total protein recovered in each fraction or cell lysate. * marks lanes containing similar concentrations of proteins from cell lysates (lane 2) and sucrose gradient fraction 3 (lane 7).
(C) RNA 2100 Bioanalyzer analysis of large RNA species (left panel) and PAGE analysis of small RNA species ranging from 50 to 300 bp (right panel). Bottom panel shows total RNA yield from each fraction. * marks lanes with similar RNA yield from cells (lane 1) and sucrose gradient fraction 3 (lane 4).
(D) qPCR analysis of miRNA abundance in equal volumes of RNA purified from each fraction.
(E) qPCR analysis of the abundance of the indicated RNA species detected in fraction 3 (top) or in fraction 6 (bottom) left untreated or treated with RNase A or RNase A and Triton X-100.
Data are representative of three independent experiments. Statistical significance is measured using a one-tailed t test: *p < 0.05, **p < 0.01, and ***p < 0.001.
Error bars indicate SD of the mean. See also Figure S1.
