
Figure 6. nSMase Inhibitor Induced the Accumulation of Activation-Induced EV-Enriched tRFs, but Not Activation-Independent EV-Enriched tRFs, within Rab7-Containing MVB Compartments.
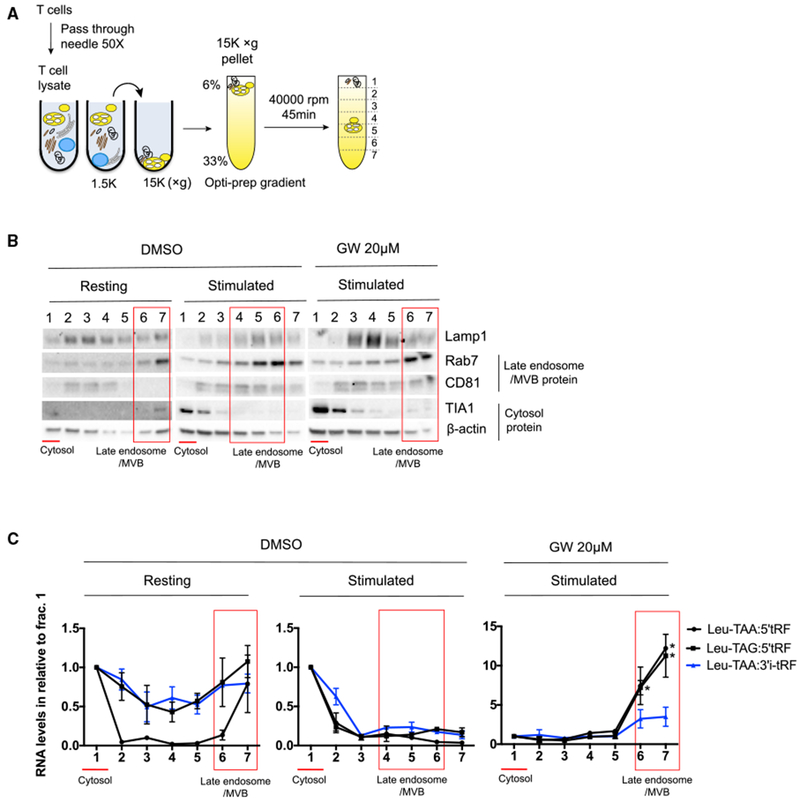
(A) Schematic of subcellular fractionation of T cells. 15,000 × g pellets obtained from differential centrifugation of T cell lysates were layered on the top of the Optiprep gradient and then centrifuged at 40,000 rpm for 45 min to separate different membrane organelles or cytosolic proteins.
(B and C) Western blot analysis of proteins (B) and stem-loop qRT-PCR quantification of tRFs in subcellular fractions obtained from resting conditions or activated conditions treated with DMSO or GW4869 (C). For each fraction, RNA concentration is normalized to fraction 1. In (B) and (C), red lines indicate cytosolic fractions, and red boxes indicate MVB fractions.
Data are representative of two independent experiments. Statistical significance is measured using a one-tailed t test: *p < 0.05, **p < 0.01, and ***p < 0.001. Error bars indicate standard deviation of the mean. See also Figure S6.