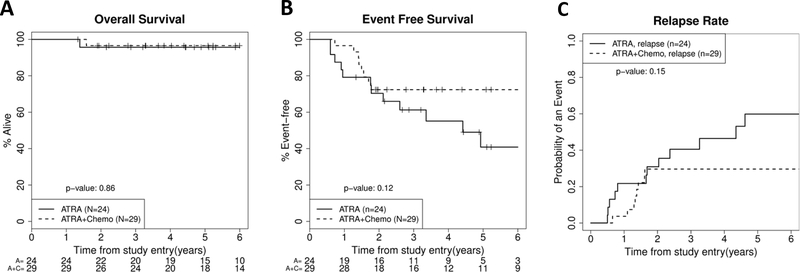
FIGURE 3.
Survival and relapse risk for patients <18 years stratified by maintenance therapy. Kaplan-Meier plots for overall survival (A), event free survival (B) and relapse risk (C). For figure 3C, death without relapse curves are not shown because there were none of these events for either group. These demonstrate no significant difference in outcome by maintenance arm, but of interest there were more relapses after 2 years (the end of therapy) in the non-chemotherapy maintenance group. These survival curves represent patients who completed induction and consolidation to be eligible for maintenance randomization and thus survival is higher than in the entire cohort represented in Figure 2.

