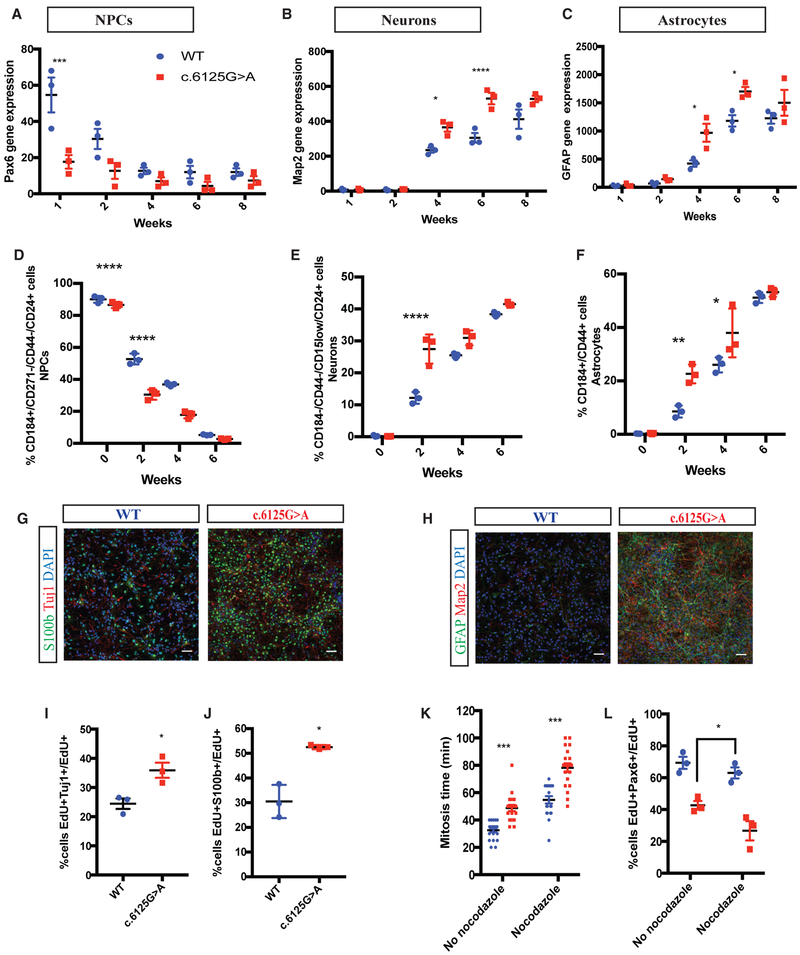
Figure 4. KNL1c.6125G > A Differentiating Neuro-Glial Cultures Differentiate Prematurely, at the Expense of Neural Stem Cell Proliferation.
(A–C) Time-course analysis of neural progenitors marker PAX6 (A), neuronal marker MAP2 (B), and glial marker GFAP (C), using real-time qPCR in a wild-type and KNL1c.6125G > A neuro-glial differentiating culture. ANOVA was performed followed by a post hoc group comparisons using a Bonferroni test.
(D–F) Time-course analysis of neural progenitors (D), neurons (E), and astrocytes (F), using quantification based on cell-surface markers of wild-type and KNL1c.6125G > A neuro-glial differentiating culture. ANOVA was performed followed by a post hoc group comparisons using a Bonferroni test.
(G) Immunostaining using antibodies against S100b and Tuj1 in wild-type and KNL1c.6125G > A in a neuro-glial culture, at 4 weeks of differentiation (scale bar, 50 μm).
(H) Immunostaining using antibodies against GFAP and MAP2 in wild-type and KNL1c.6125G > A in a neuro-glial culture, at 6 weeks of differentiation (scale bar, 50 μm).
(I) FACS-based quantification of EdU+TUJ1+/EdU+ cells following 1-day post EdU pulse-chase assay in 2-week-old neuro-glial differentiating culture. Welch’s t test (two-tailed) was applied.
(J) FACS-based quantification of EdU+S100β+/EdU+ cells following 1-day post EdU pulse-chase assay in 2-week-old neuro-glial differentiating culture. Welch’s t test (two-tailed) was applied.
(K) Quantification of the mitosis time in wild-type and KNL1c.6125G > A 1-week differentiating culture using live imaging, in the presence and absence of nocodazole. Each point represents a dividing wild-type or KNL1c.6125G > A cell, from three different wild-type and KNL1c.6125G > A clones. ANOVA was performed followed by a post hoc group comparisons using a Bonferroni test.
(L) Quantification of EdU+PAX6+/EdU+ in wild-type and KNL1c.6125G > A 1-week differentiating culture following a pre-incubation with EdU for 1 hr and a 90-min nocodazole treatment. ANOVA was performed followed by a post hoc group comparisons using a Bonferroni test.
One non-targeted wild-type clone, two wild-type clones and three patient mutation clones derived from the same CRISPR-Cas9 targeting are plotted in each graph. Results are mean ± SEM. *p < 0.05, **p < 0.01, ***p < 0.001, ****p < 0.0001.

