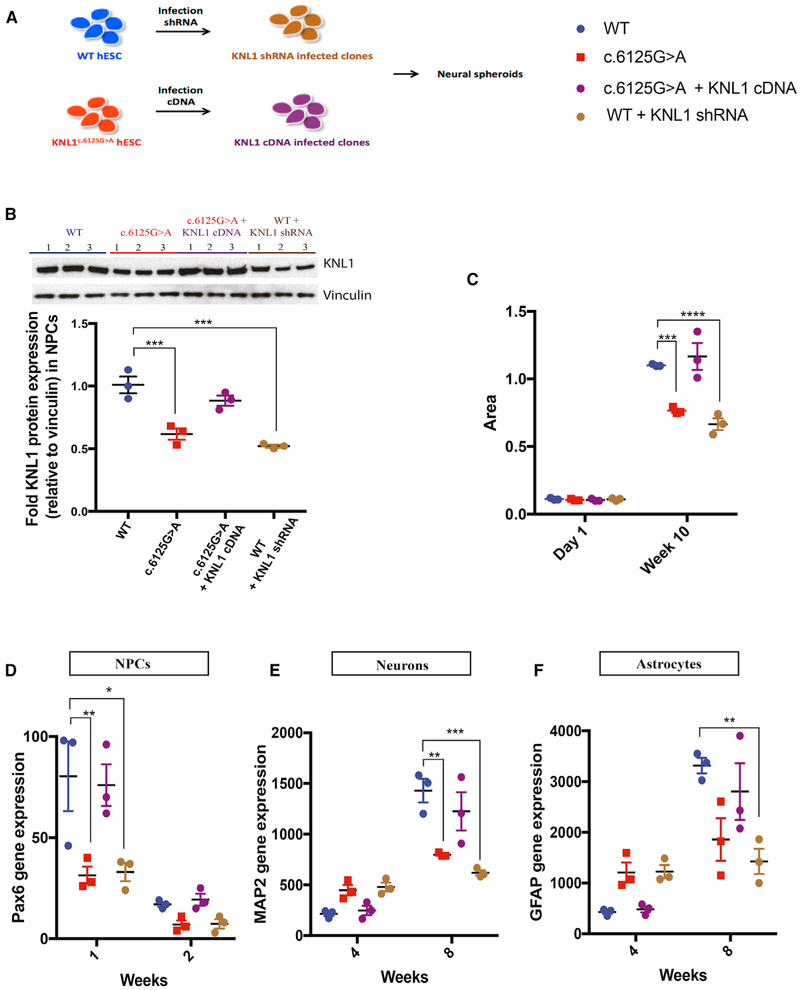
Figure 6. KNL1c.6125G > A Three-Dimensional Neural Spheroids Size Reduction and Premature Differentiation Is Mimicked by Knockdown and Rescue Experiments.
(A) Schematic overview of the generation of stable cell lines with shRNA and overexpressed KNL1.
(B) Western blot analysis and quantification of KNL1 expression of wild-type, KNL1c.6125G > A, wild-type shRNA, and KNL1c.6125G > A +KNL1 cDNA neural progenitors, 10 days post-differentiation. ANOVA was performed followed by a post hoc group comparisons using a Bonferroni test.
(C) Area measurement of wild-type, KNL1c.6125G > A, wild-type shRNA, and KNL1c.6125G > A +KNL1 cDNA neural spheroids in a time course at 10 weeks. ANOVA was performed followed by a post hoc group comparisons using a Bonferroni test.
(D–F) Time-course analysis of neural progenitors marker PAX6 (D), neuronal marker MAP2 (E), glial markers GFAP (F) using real-time qPCR in wild-type, KNL1c.6125G > A, wild-type shRNA, and KNL1c.6125G > A +KNL1 neural spheroids. ANOVA was performed followed by a post hoc group comparisons using a Bonferroni test.
One non-targeted wild-type clone, two wild-type clones, and three patient mutation clones derived from the same CRISPR-Cas9 targeting are plotted in each graph. Results are mean ± SEM. *p < 0.05, **p < 0.01, ***p < 0.001, ****p < 0.0001.

