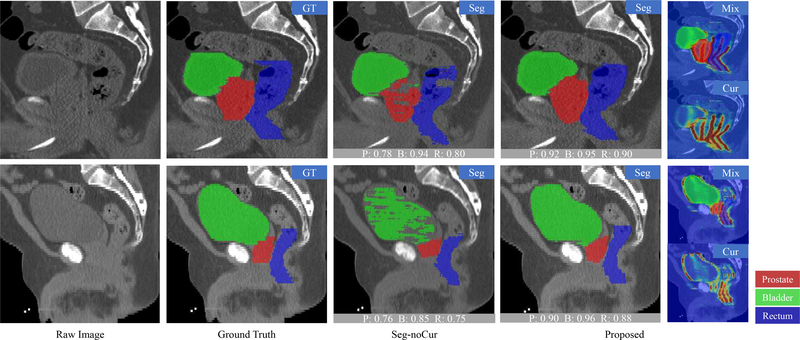
Fig. 7.
Visualization of the segmentation results of prostate, bladder and rectum by using the proposed method and Seg-noCur method. The curve delineation results are also provided. The gray block at the bottom of the image denotes the DSC of this image. “P” denotes the prostate, “B” denotes the bladder, and “R” denotes the rectum. The probabilities of the curves are marked from blue to red, which indicates the probabilities from low to high.

