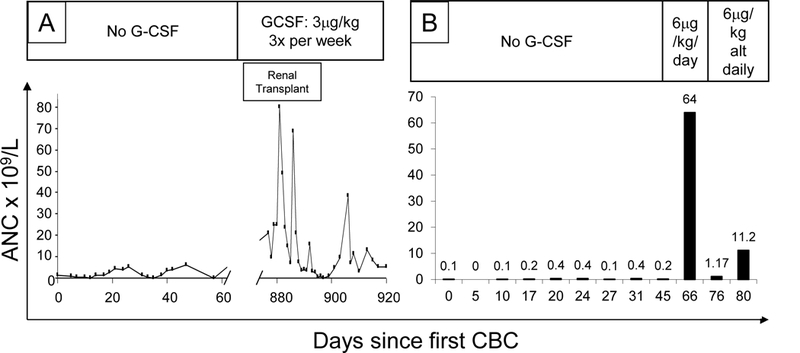
Figure 4. Exuberant responses to G-CSF.

UPN37 showed a range of ANC of 0.1 to 5.9 × 10⁹/L in the year before commencing G-CSF at 3mcg/kg/dose thrice weekly. His ANC ranged from 0.2 to 79.9 in the 6 weeks afterwards, although renal transplantation (required as a consequence of previous Haemophilus sepsis) may have contributed to these dramatic changes. By contrast, no events occurred in UPN51 (shown in B), whose ANC rose to 64 × 109/L, from a maximum ANC of 0.6 × 10⁹/L in nine CBCs taken at regular intervals over the previous two months, after G-CSF was introduced at 10mg/kg/day; this necessitated switching to alternate daily dosing.
