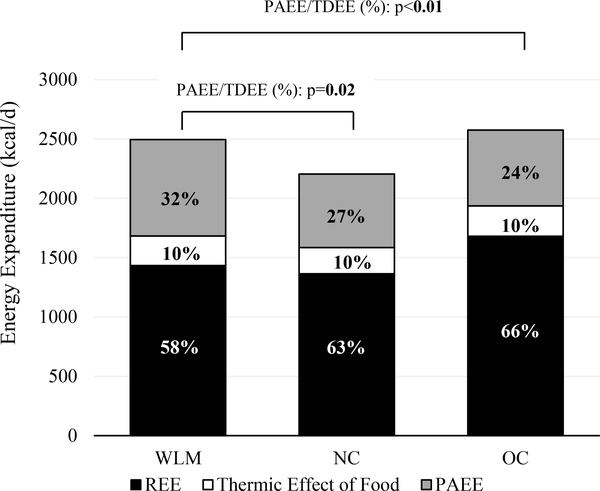
Figure 3: Proportion of Physical Activity Energy Expenditure out of Total Daily Energy Expenditure across Subject Groupa-b.
aResults are from one-way ANOVA and presented as untransformed means (kcal/d). Significant P values (alpha < 0.05) indicated in bold. Labels represent the mean proportion of each component out of the mean total daily energy expenditure for each subject group. Weight Loss Maintainers (WLM); Normal Weight Controls (NC); Controls with Overweight/Obesity (OC); Physical Activity Energy Expenditure (PAEE); Resting Energy Expenditure (REE).
bMean±SD of PAEE/TDEE (%): WLM 32±7%, NC 27±7%, OC 24±8%; WLM:NC P = 0.02, WLM:OC P < 0.01.

