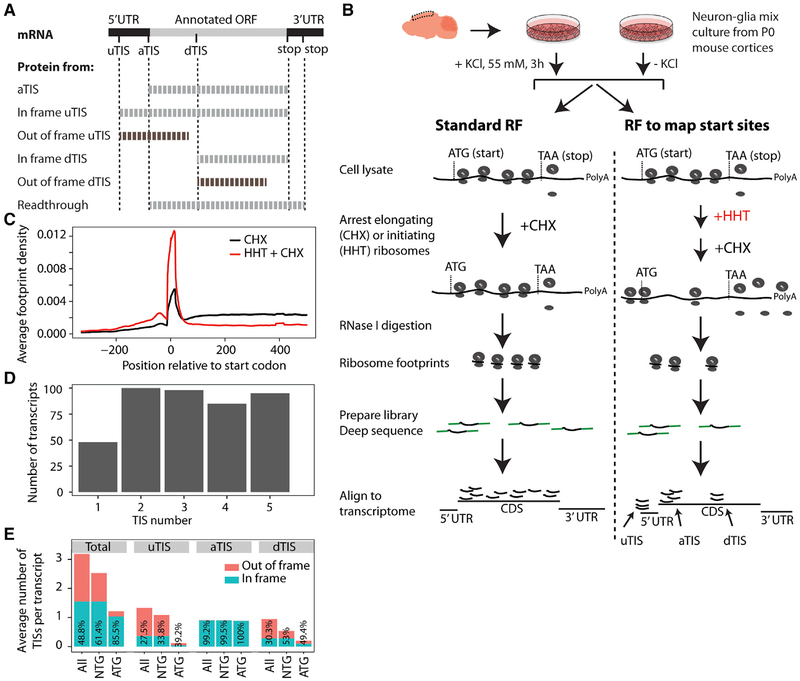
Figure 1. RF of Homoharringtonine-Treated Neuron-Glia Culture Reveals Translation Initiation Sites.
(A) uTISs, aTISs, and dTISs and the corresponding protein products are depicted. uTISs and dTISs give rise to N-terminal variants of the protein when in frame, but code for completely new polypeptide sequences when out of frame. Stop codon readthrough that generates a C-terminal extension is also depicted. In this study, Figures 1, 2, and 3 concern TISs, and Figures 4, 5, and 6 concern readthrough.
(B) Experimental workflow for the in vitro study. Mixed neurons and glia from post-natal day (P)0 mice were cultured for 7 days in vitro, exposed to KCl or no KCl, and subjected to RF and TIS-mapping RF as shown.
(C) Average ribosomal density across transcripts shows a run-off of elongating ribosomes from the proximal 300-nt region of the coding sequence in the HHT-treated sample as compared to the no-HHT sample. Plot from the KCl-untreated cultures is shown; KCl-treated cultures gave the same density distributions.
(D) The number of high-fidelity TISs in the 426 most robustly expressed transcripts. Most of the transcripts showed >1 TIS. Only the top-five TISs were called.
(E) Codon composition and frame status of TISs across transcripts. TIS codons are shown as ATG or a cognate thereof (NTG). Numbers inside the bars indicate the percentages of in-frame TISs.
RF, ribosome footprinting; HHT, homoharringtonine; TIS, translation initiation site; u/a/dTIS, upstream/annotated/downstream TIS. Also see Figures S1 and S2 and Table S1.

