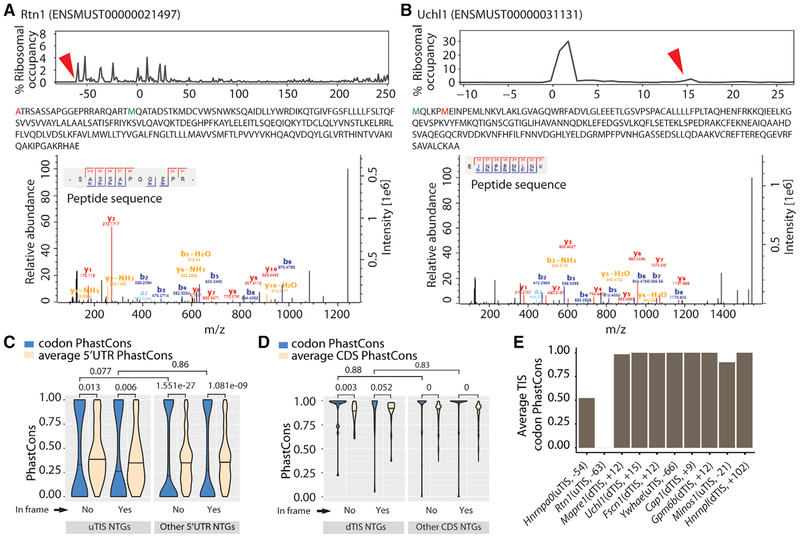
Figure 2. Mass Spectrometry Detects the Peptides Resulting from Alternative TISs.
(A and B) Peptides resulting from an in-frame uTIS (Rtn1) (A) and an in-frame dTIS (Uchl1) (B). Upper: the percentage of ribosomes at different TISs (red arrowheads correspond to alternative TISs whose novel products are detected; zeros correspond to aTISs). Middle: the peptide sequences with the amino acids corresponding to alternative TISs and aTISs in red and green, respectively. Bottom: the tandem mass spectra and mass-to-charge ratios of b and y product ions confirming peptide sequences. Alternative TISs for Rtn1 and Uchl1 lie at the −63rd and +15th nt relative to the aTIS, respectively.
(C and D) Conservation of uTISs with respect to 5′ UTR (C) and of dTISs with respect to CDS (D). Violin plots show the average of the PhastCons scores for the 3 nt of the ATG, CTG, GTG, or TTG present at the uTISs or dTISs or elsewhere in the 5′ UTR or CDS. Wilcoxon test was used to assess the statistical significance.(E) Conservation of the uTISs and dTISs of mass spectrometry-confirmed peptide products. Plot shows the average of the PhastCons scores of the 3 nucleotides. Also see Tables S1 and S2.

