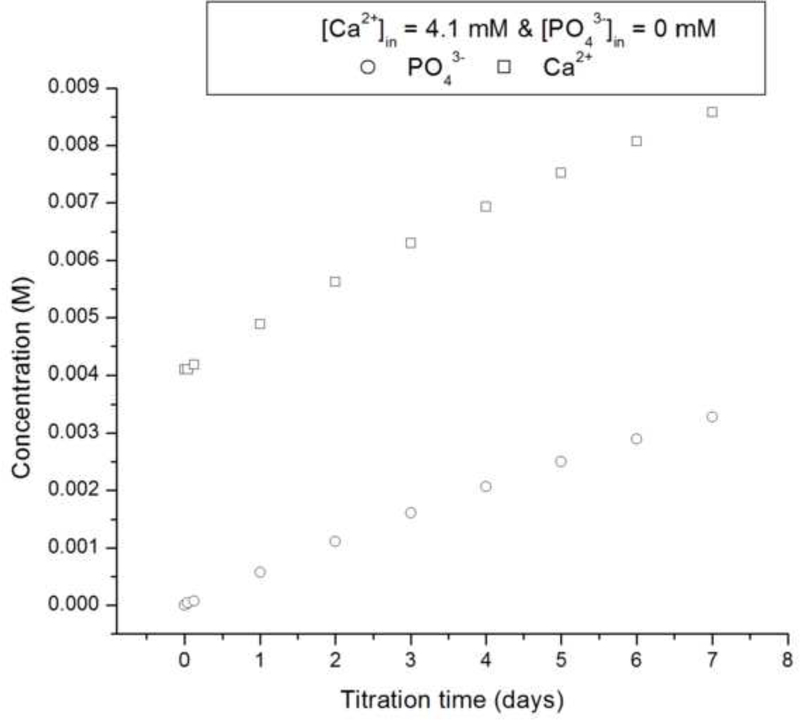
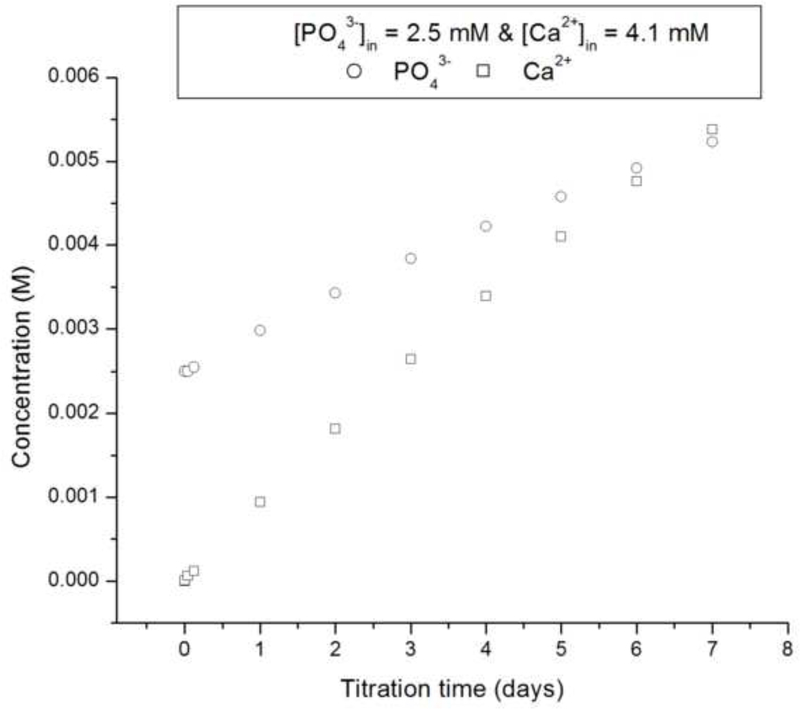
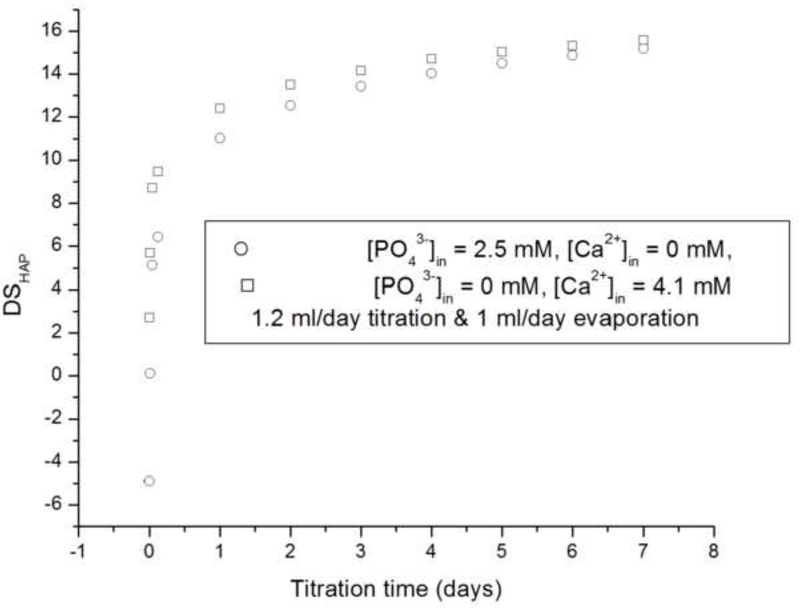
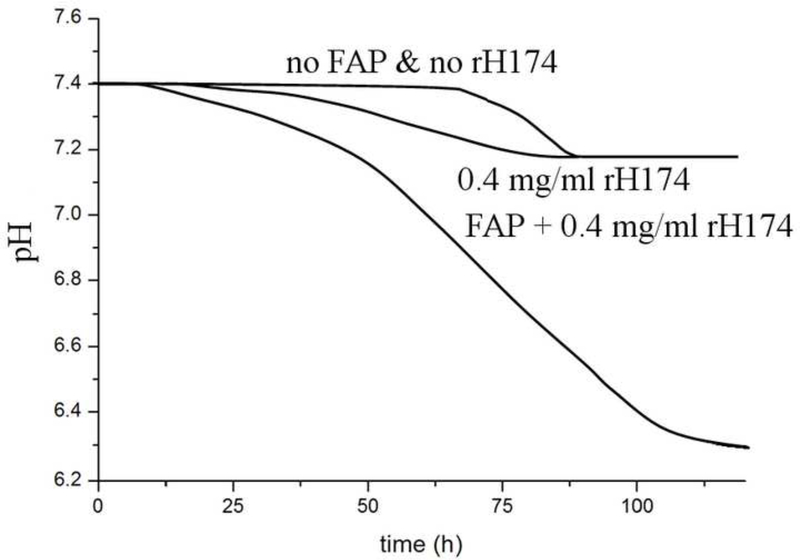
Fig.13.
The calculated values for calcium (□) and phosphate (o) concentrations (a,b) and DS (c) in the reaction suspension with the assumption of no precipitation for systems II (a, c) and III (b, c) versus the reaction time; pH vs time curves for the aging of metastable solutions of Ca2+ and HxPO4x−3 (DS = 10.9 with respect to apatite) at 37 °C with and without the FAP substrates and 0.4 mg/ml rH174 (d).


