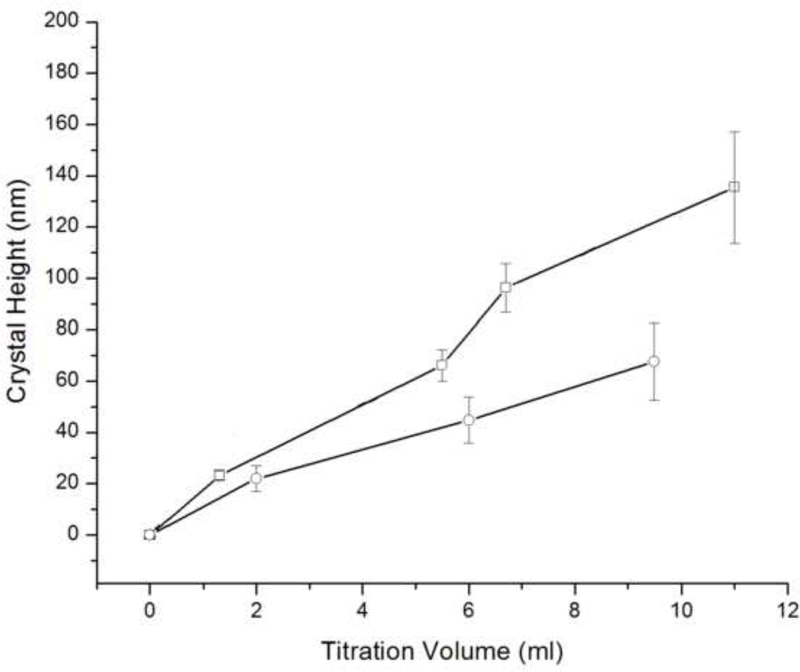
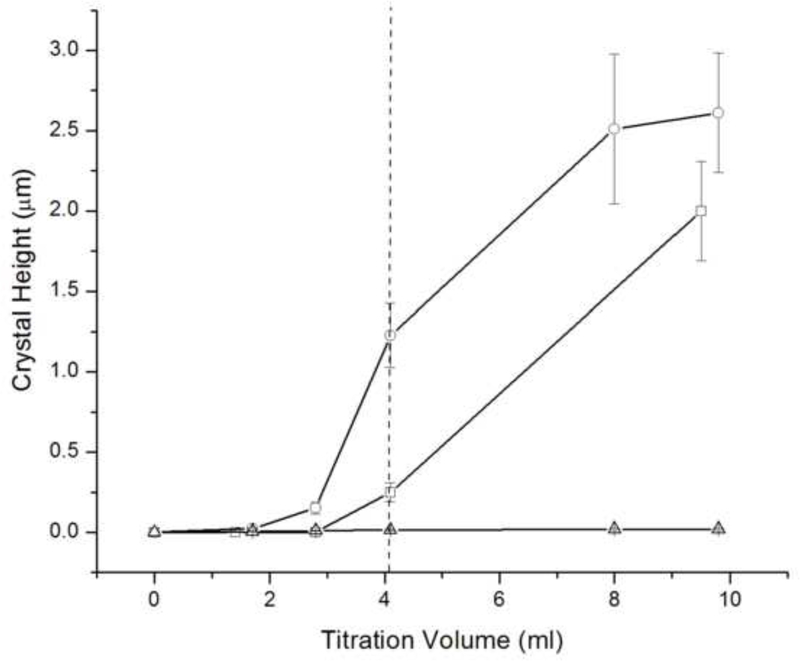
Fig.6.
The average height of apatite crystals grown in system I after different titration volumes compared between 0.4 mg/ml rH174 sample (-□-) and a control sample with no protein (-o-) (a), and of apatite crystals grown in systems III (-o-) and II (-□-) with 0.4 mg/ml rH174, as compared to the control sample with no protein (-Δ-) (b).


