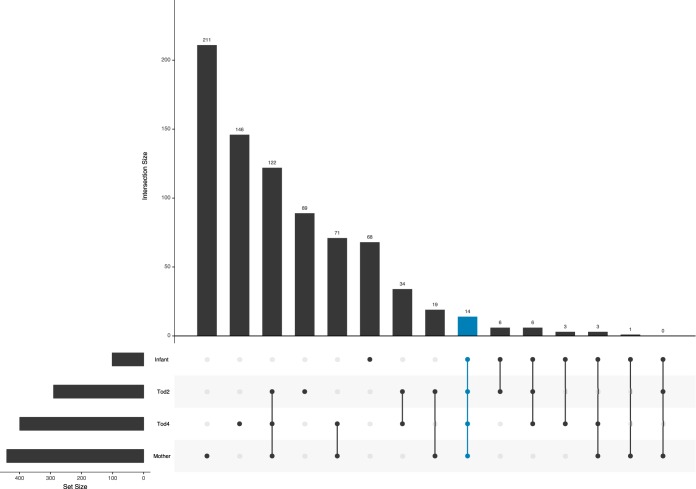
FIG 4.
UpSet plot showing ESVs shared between infant samples and samples from 2-year-old children, 4-year-old children, and mothers. The numbers of unique ESVs shared between groups or intersections of groups are plotted as vertical bars. The 14 “core” ESVs shared between all four sample groups are indicated in blue.

