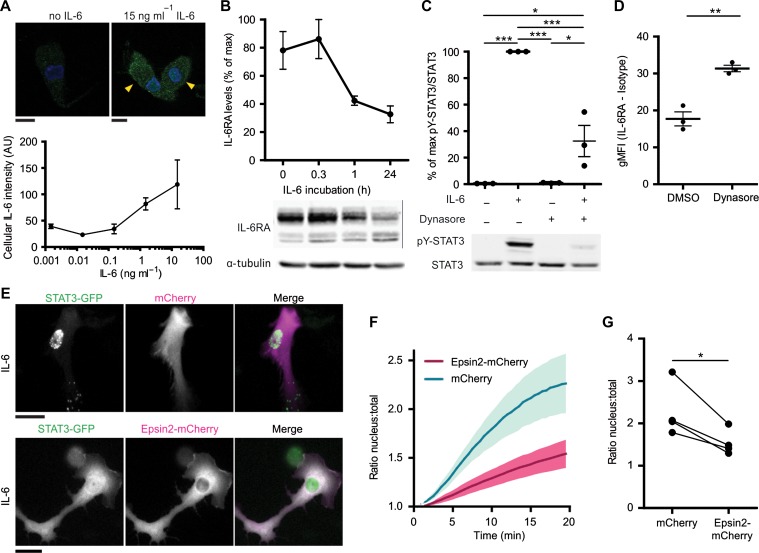
Figure 4.
Endocytosis of IL-6 is required for paracrine STAT3 signaling. (A) MoDCs incubated with increasing concentrations of IL-6 for 20 min and immunostained for intracellular IL-6 (green) were imaged by confocal microscopy. DAPI is in blue. Yellow arrowheads indicate IL-6-positive cells. Graph: quantification of IL-6 signals (mean ± SEM from three donors). Scale bar, 10 μm. (B) Quantification of IL-6RA upon incubation with IL-6 for the indicated times by western blot (see also Figure 2G). Data were normalized to the highest IL-6RA band intensity per donor. α-tubulin is loading control. (C) STAT3 tyrosine 705 phosphorylation (pY-STAT3) of moDCs incubated with or without hydroxy-dynasore and/or 15 ng/ml IL-6. Graph: quantification for three different donors (mean ± SEM). Data were normalized to the highest pY-STAT3/STAT3 ratio per donor. (D) Flow cytometry of moDCs incubated with or without hydroxy-dynasore and immunostained for surface IL-6RA. gMFI of different donors are shown (isotype subtracted). (E) Fluorescence microscopy images of moDCs transfected with STAT3-GFP (green in merge) and only mCherry or Epsin2-mCherry (magenta in merge) and stimulated with IL-6 for 20 min. Scale bar, 20 μm (see also Supplementary Movies S1 and S2). (F) Quantification of STAT3-GFP retention at the nucleus following IL-6 stimulation in E (mean ± SEM for 80 cells from four donors). (G) Quantification of STAT3-GFP retention at the nucleus at 20 min after IL-6 stimulation for only mCherry (cntrl) or Epsin2-mCherry (from F; individual donor averages shown for 20–23 cells/donor).

