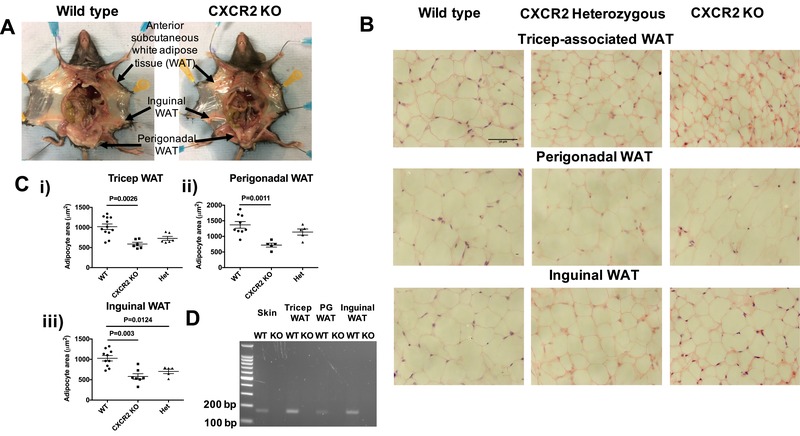
Figure 2.

Adipocytes from multiple sources are smaller in CXCR2 KO female mice, compared to wild‐types. (A) Mice were dissected to allow visualization of white adipose tissue (WAT) depots at the indicated sites. (B) WAT was dissected, fixed, and processed from each of these 3 areas and sections were stained with H&E (scale bars: 50 μm) from wild‐type, CXCR2 heterozygous (het), and CXCR2 knockout (KO) mice. (C) The area occupied by individual adipocytes was calculated and averaged for each individual mouse, data from each mouse was plotted for (i) tricep; (ii) perigonadal, and (iii) inguinal sites, where each symbol represents an individual mouse. (D) Skin and adipose depots were dissected from WT and CXCR2 KO mice and analyzed for CXCR2 expression by nonquantitative PCR as demonstrated by an expected product of 169 base pairs from the CXCR2 specific primer set. Data from two experiments are pooled and plotted as mean (±sem). Data were analyzed using an ordinary one‐way ANOVA with Tukey's post hoc test (Cii and iii) or with a Kruskal‐Wallis test (Ci)
