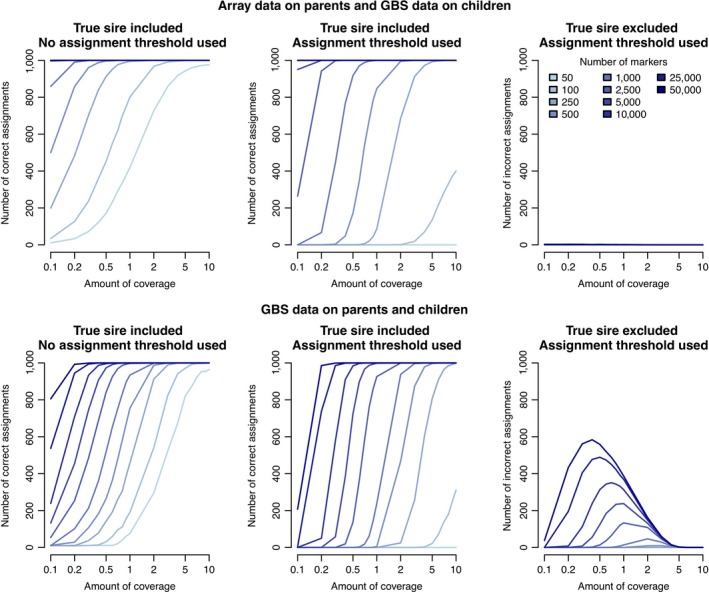
Figure 2.

Parentage assignment performance when array or GBS data was available for the parents and GBS data was available for the progeny. The left panels give the number of correct assignments (for 1,000 progeny) when the true parent was on the list of putative parents and no assignment threshold was used, and the top scoring parent was always assigned. The middle panels give the number of correct assignments when the true parent was on the list of putative parents and assignment threshold was used. The right panels give the number of incorrect assignments when the true parent was excluded from the list of putative parents [Colour figure can be viewed at wileyonlinelibrary.com]
