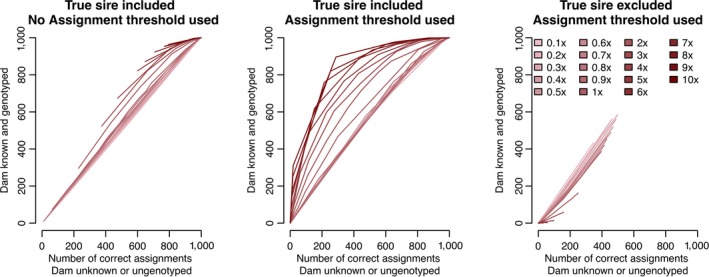
Figure 4.

A comparison between the parentage assignment performance with one parent known and genotyped and no parent known at different GBS coverage levels (left and middle panes compare true positives while the right pane compares false positives) [Colour figure can be viewed at wileyonlinelibrary.com]
