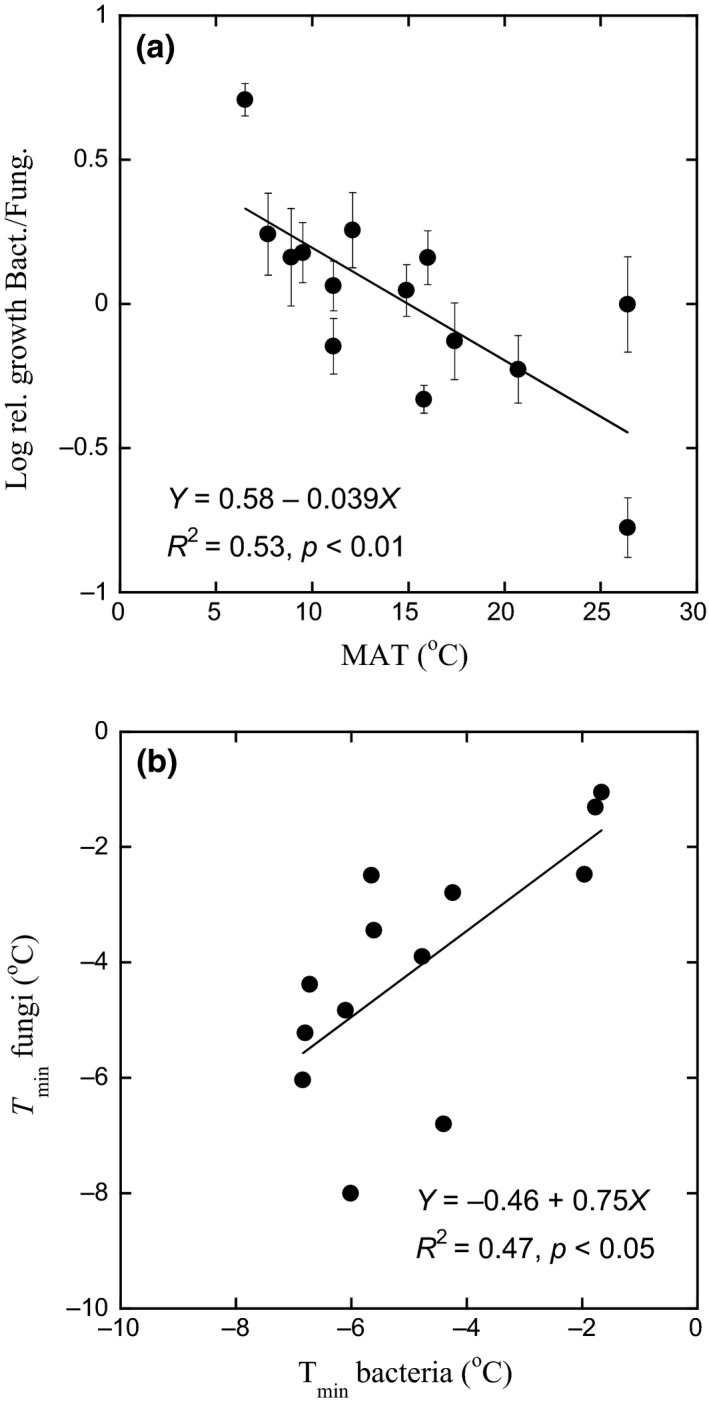
Figure 4.

Comparison of the temperature responses of bacterial and fungal growth along an elevation gradient in the Andes, as affected by differences in mean annual temperature (MAT). (a) Relative bacterial to fungal growth. Growth of bacteria was estimated as leucine incorporation and for fungi as acetate‐in‐ergosterol‐incorporation method at 15°C. The data were normalized to a log value of 0 at MAT of 15°C. Bars indicate SE (n = 5). Regressions were calculated with mean values for each site (n = 14). (b) Correlation between T min for bacterial and fungal growth
