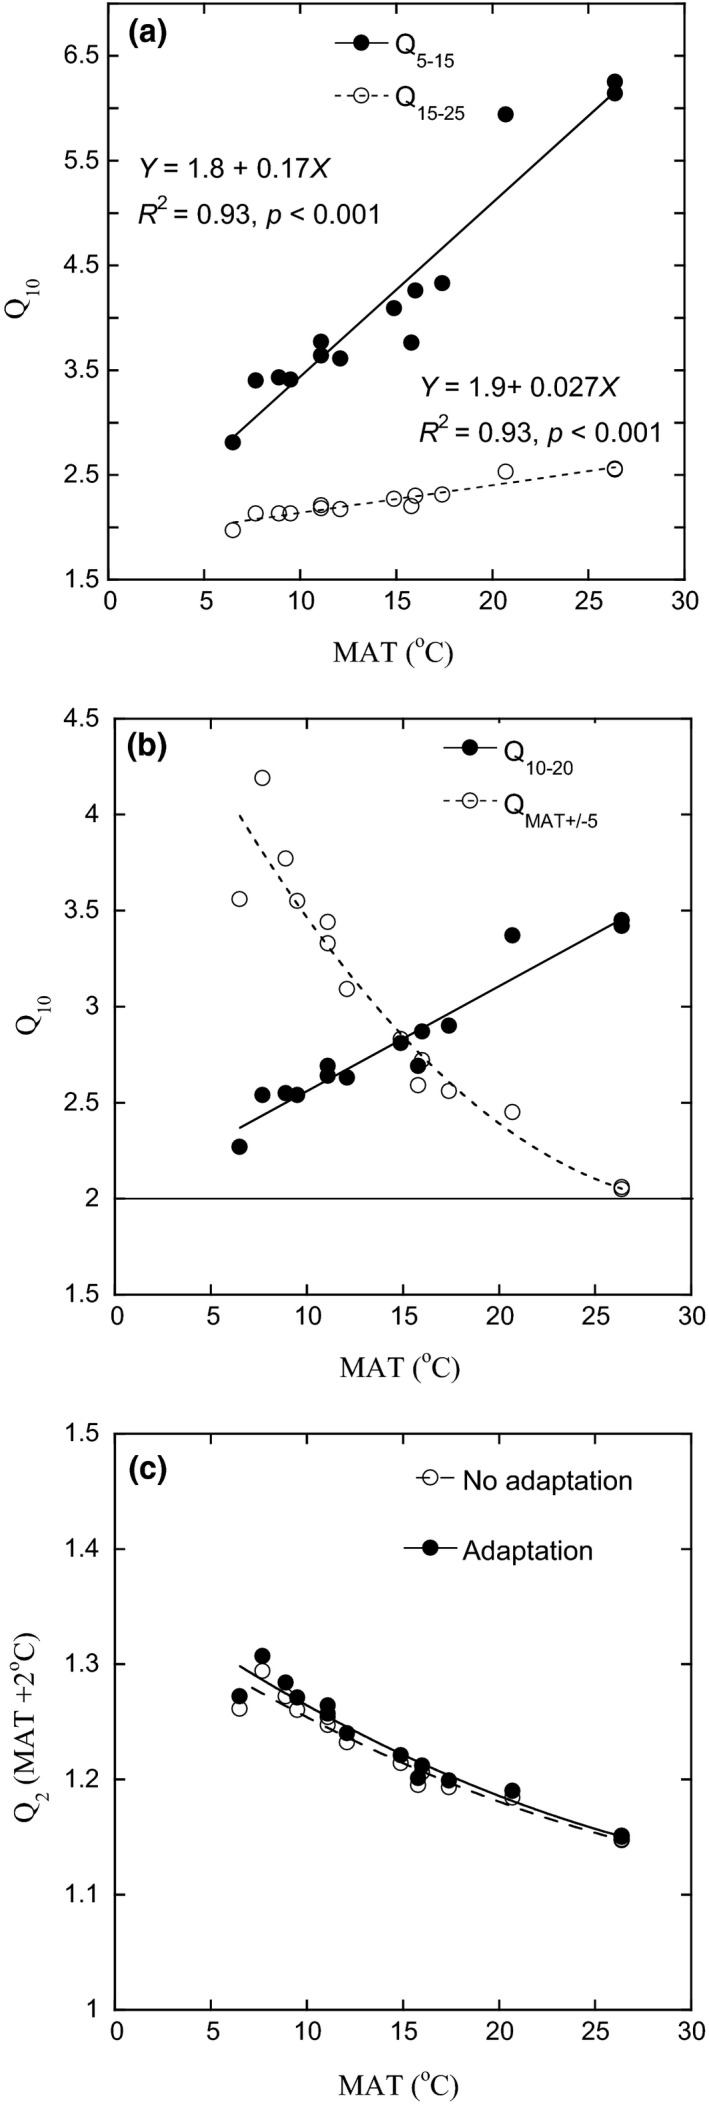
Figure 5.

The effect of using different temperature ranges, according to MAT differences along an elevation gradient, to calculate Q 10 values for bacterial growth. (a) Q 10 calculated using T min from Figure 2a in the range 5–15°C and 15–25°C. (b) Standardized Q 10 (10–20°C) calculated using T min from Figure 2a, compared with in situ specific Q 10 (MAT ±5°C; Y = 5.2–0.21X + 0.0033X 2, R 2 = 0.92). The thin line at a value of 2 for Q 10 indicates an approximately upper limit for Q 10 for most enzyme activities (V max) for these sites (Nottingham et al., 2016). (c) Predicted increases in growth with a 2°C increase in MAT calculated using T min from Figure 2a. “No adaptation” was calculated using Equation ([Link]), while “adaptation” was calculated assuming a 0.6°C increase in T min
