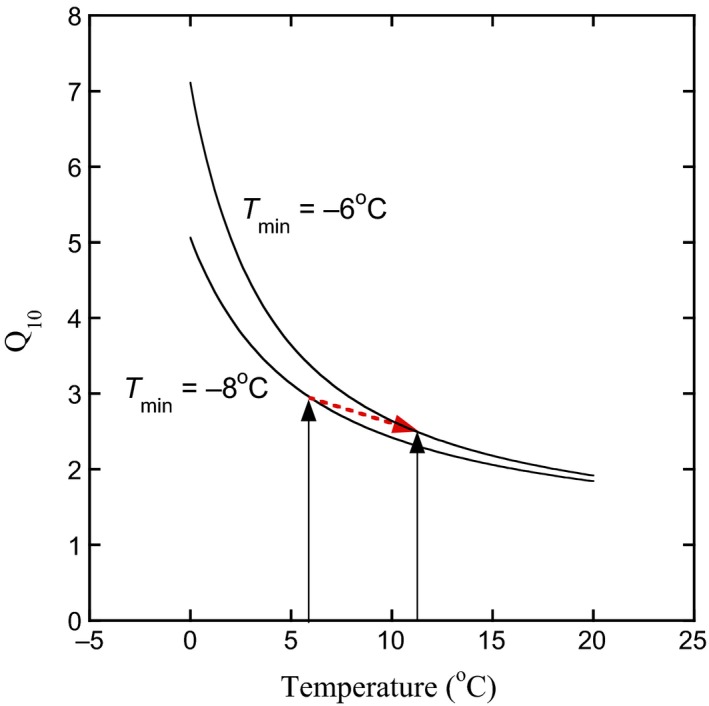
Figure 6.

Conceptual figure on the effect of increasing MAT on Q 10, calculated using the square root relationship. A soil with MAT of 6°C, and a T min of −8°C, has Q 10 ~3 (left black arrow). By increasing MAT by 6°C to 12°C (right black arrow), there is a decrease in Q 10 (~2.7) but an increase in T min (by 2°C to −6°C). The new T min trajectory results in a decrease in Q 10 when calculated at the new temperature (Q MAT+2; red dashed arrow) but a higher Q 10 if calculated across a fixed temperature range (e.g., Q 0–10). The trajectories were calculated using the square root relationship for T min of −6 and −8°C (see Bååth, 2018) [Colour figure can be viewed at wileyonlinelibrary.com]
