
Figure 4.
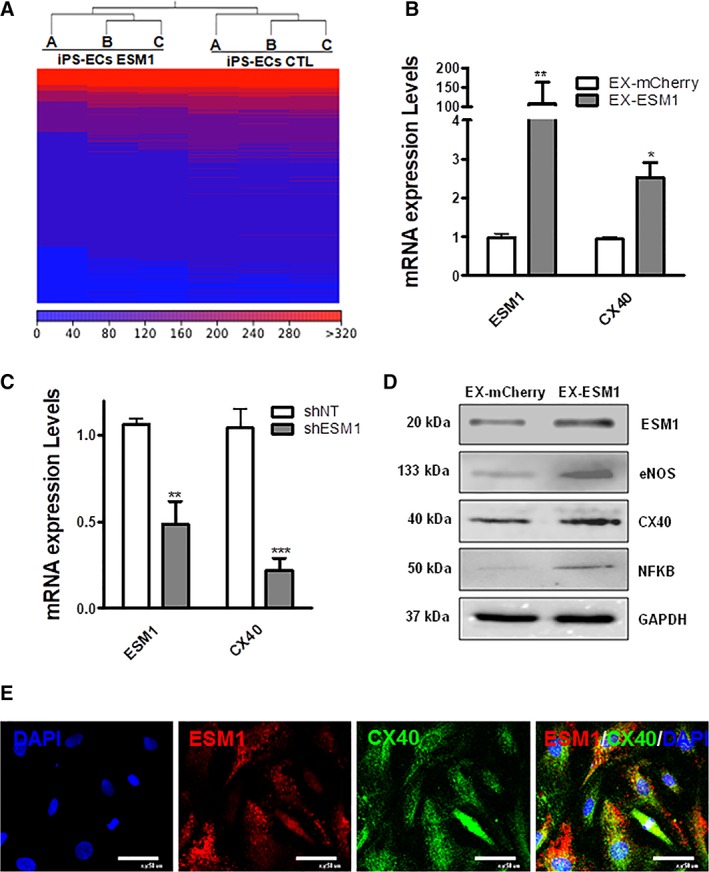
ESM1 regulates CX40 expression. (A): Heat map of RNA level differences between induced pluripotent stem‐endothelial cells (iPS‐ECs) overexpressing ESM1 (EX‐ESM1) compared with control iPS‐ECs (EX‐mCherry). (B): Overexpression of ESM1 leading to a significant increase in CX40 48 hours after transfection with EX‐ESM1 compared with control (EX‐mCherry; data are means ± SEM [n = 3]; *, p < .05; **, p < .01). (C): Knockdown of ESM1 leading to a significant decrease in CX40 72 hours after lentiviral transduction with shESM1 compared with non‐targeting control (shNT; data are means ± SEM [n = 3]; **, p < .01; ***, p < .001). (D): Western blots showing increased protein levels in ESM1, eNOS, CX40, and NFKB 48 hours after ESM1 overexpression. (E): Immunofluorescent images of cells costained with ESM1 (red), CX40 (green), and DAPI (blue). Scale bars are 50 μm. The data presented are representative or means (±SEM) of three independent experiments.