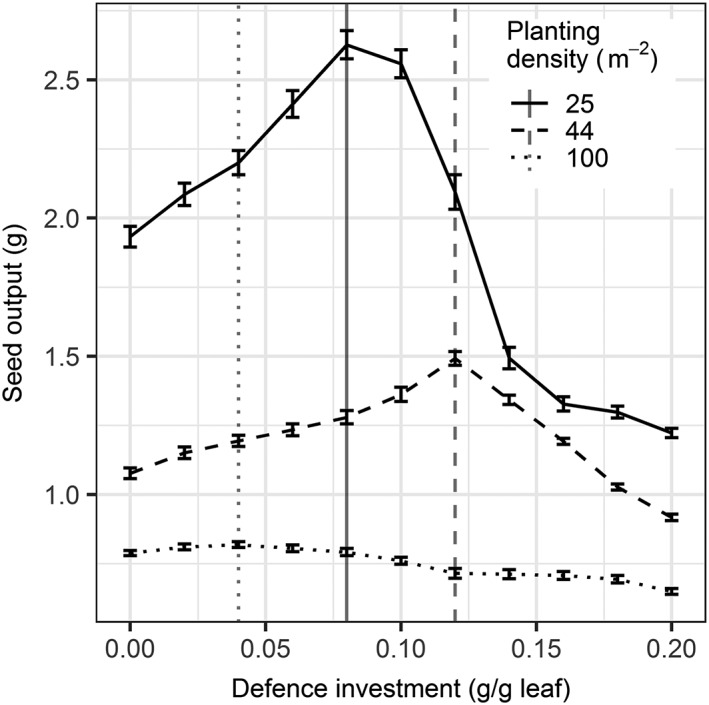
Figure 3.

The relationship between investment in defence (g defence/g plant biomass) and seed production (grams) of plants that distribute defence homogeneously over leaves for three different densities (line type) and a given level of herbivory. The vertical lines denote the optimum levels of defence for each density. Error bars represent standard error of the mean seed output (n = 20)
