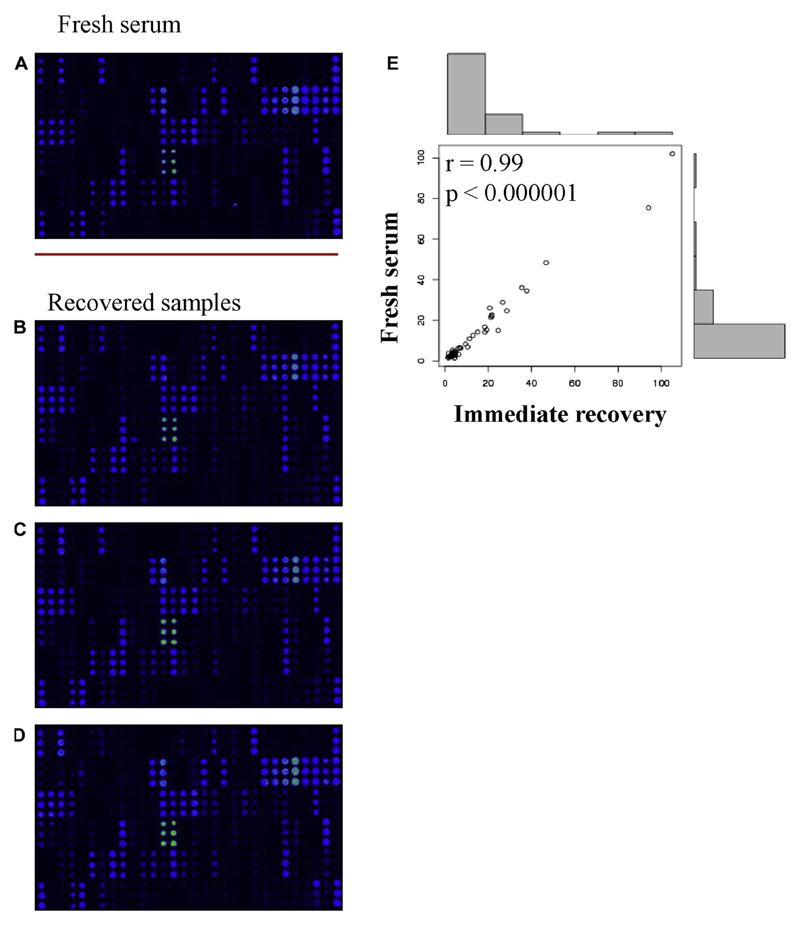
Fig. 2.
Screen-shots of IgG reactivity to micro-arrayed allergens in (A) a fresh serum sample and in (B-D) immediately recovered eluates from 3 identically prepared paper-dried blood spots. E, Scatter plot of the correlations of allergen-specific IgG levels with r and P values for the 48 recognized allergens (Table E4).

