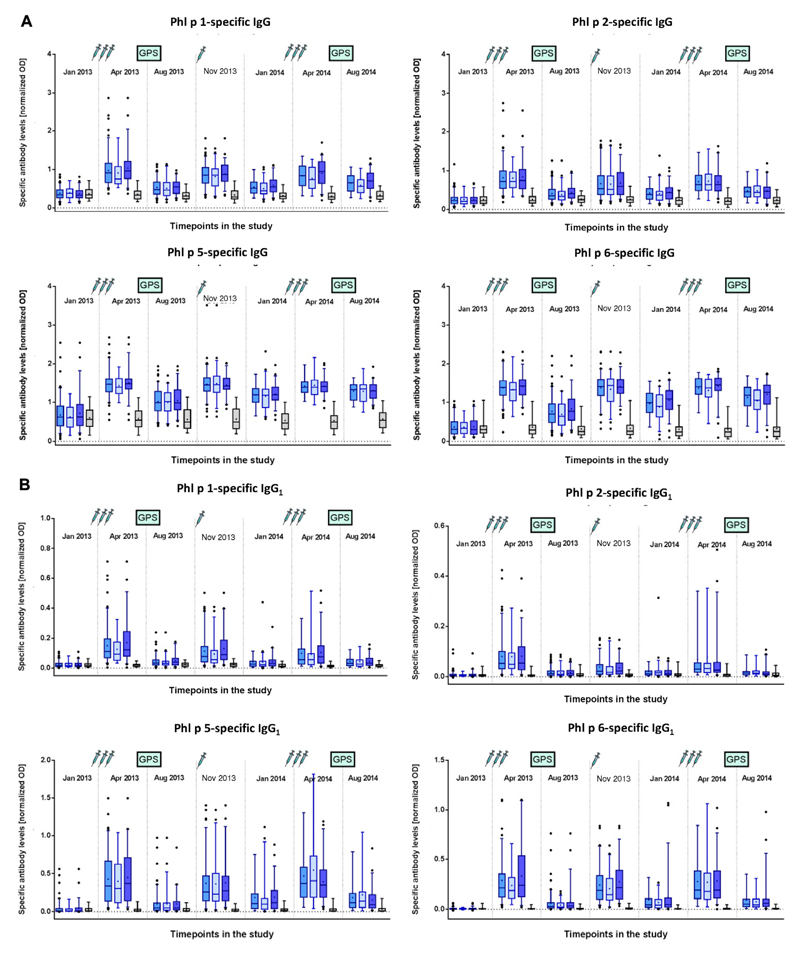
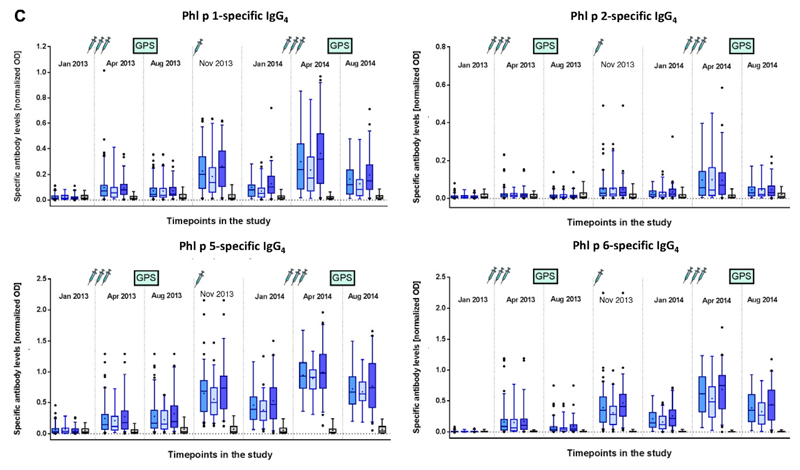
Fig 5.
Development of allergen-specific IgG and IgG subclass responses. Shown are mean IgG (A), IgG1 (B), and IgG4 (C) levels (y-axes, OD values) specific for the 4 major grass pollen allergens (Phl p 1, Phl p 2, Phl p 5, and Phl p 6) for the different treatment groups (left to right: BM32 pooled, BM32 low/low-low, BM32 high/high-low, and placebo groups) for 7 time points during the study. Injections and GPSs are indicated.


