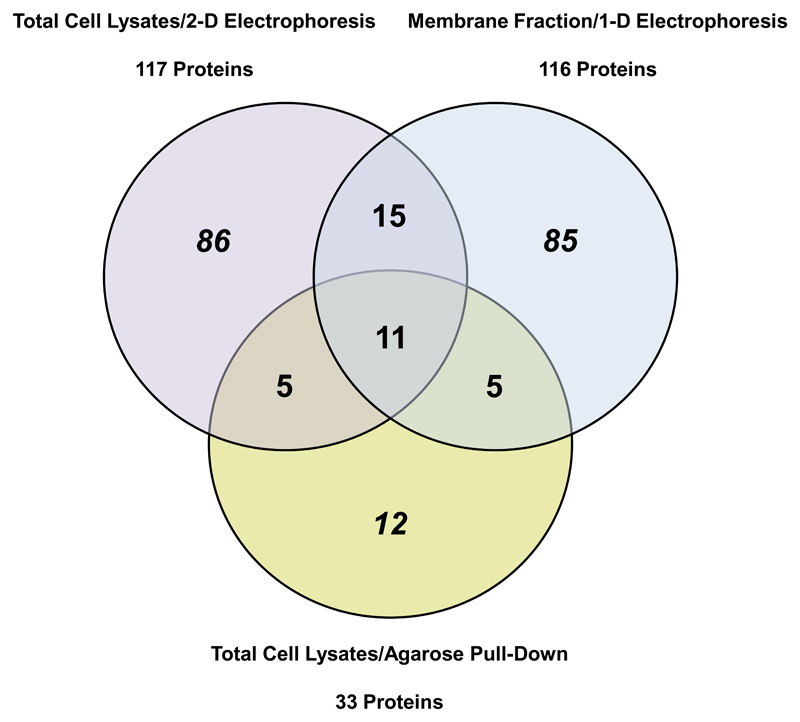
Fig. 8. Overlaps between the different proteomic approaches.
Venn diagram showing overlap of targets of 2-ClHDyA adduct formation that were identified in total cell lysates by 2-D GE (purple), the enriched membrane protein fraction after 1-D SDS-PAGE (blue), and total cell lysates by N3-agarose pull-down (yellow). The numbers represent total proteins identified in triplicate analysis of each experimental approach. Overlaps between different methods are represented by the numbers in the corresponding segments. A total of 11 identified proteins were common to all approaches.

