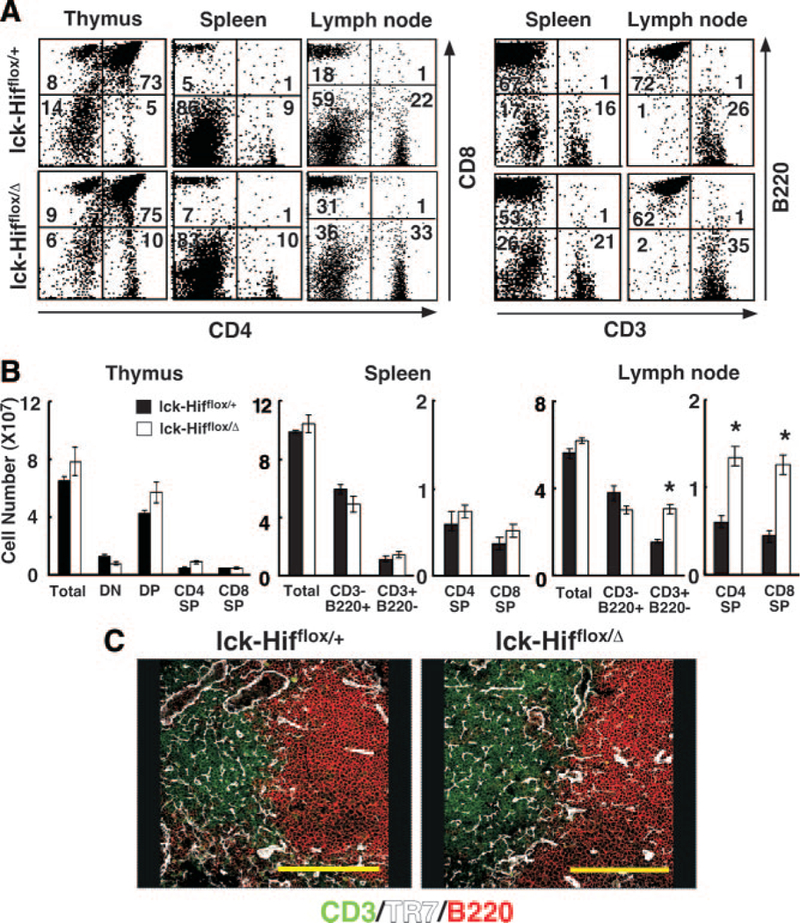
Figure 2.

Flow-cytometric analysis of lymphoid cells from Lck-Cre;Hif-1aflox/+ (lck-Hifflox/+) and Lck-Cre;Hif-1aflox/D (lck-Hifflox/D) mice. A, Lymphoid cells from thymus, lymph node, and spleen samples of 5-week-old mice with the indicated genetic characteristics were two-color stained with fluorescein iso-thiocyanate-labeled antibody (x-axis) and phosphatidylethanolamine-labeled antibody (y-axis) with the indicated specificity. The data are representative dot blots. Numbers within each box indicate the frequency of cells within the box. B, Data in bar graphs are mean±SE of lymphoid cell numbers in Lck-Cre;Hif-1αflox/+ or Lck-Cre;Hif-1αflox/Δ mice. DN indicates; DP, ; and SP, . *P<0.05. C, Three-color immunofluorescence analysis of adult lymph node sections for CD3 (green), B220 (red), and ER-TR7 (white).
