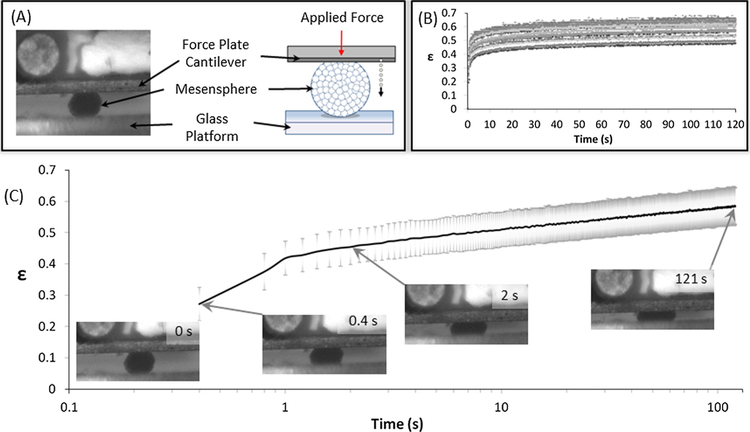
Fig. 2.
(A) Schematic of testing equipment including cantilever for force application (red arrow) and measurement, mesensphere and glass prism. Dotted arrow indicates motion tracking of cantilever displacement during compression of mesensphere. The mesensphere is placed on a glass prism and then a constant force is applied for the duration of the test. (B) Nominal creep strain (ε) calculated as tip displacement normalised to initial mesensphere height. Data from testing of n = 19 samples of day 2 Scrambled siRNA treated mesenspheres. (C) Nominal creep strain (ε) for day 2 Scrambled siRNA treated mesenspheres. The grey borders denote standard deviation of the data. Inset are representative Brightfield images showing the initial compression of the mesensphere by the cantilever at 0, 0.4, 2 s and the mesensphere in compression at the end of the test (121 s). (For interpretation of the references to colour in this figure legend, the reader is referred to the web version of this article.)

