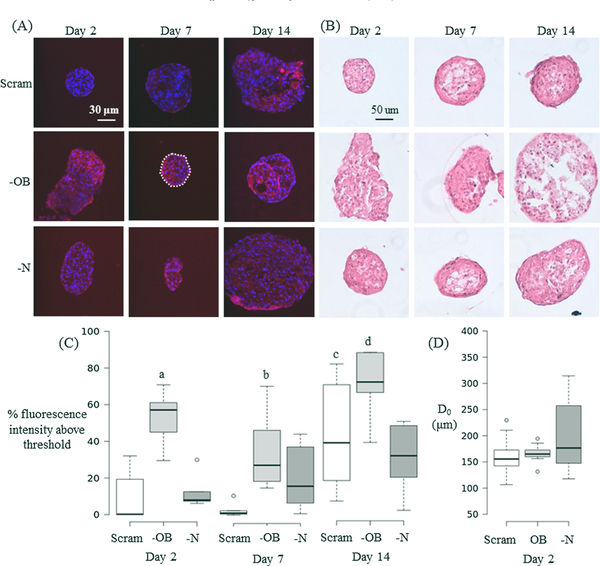
Fig. 5.
(A) Immunofluorescent images of mesenspheres at day 2, 7 and 14. The nucleus (blue) is stained with DAPI and the cytoskeleton (red) is stained with TRITC Phalloidin. The white dashed line in the central panel encloses the mesensphere area analysed for fluorescence intensity in that image. (B) H&E staining of mesenspheres at day 2, 7 and 14. (C) Boxplots of Day 2 cytoskeletal fluorescence showing % intensity above the threshold value. n = 6 samples for each group and time point. (D) Horizontal diameter of mesenspheres at day 2 measured before mechanical testing. Groups: scrambled siRNA (Scram), OB-cadherin siRNA (—OB), N-cadherin siRNA (—N). Kruskal-Wallis non-parametric tests were performed and significance is declared at p < 0.05. For (C) a < 0.002 vs. day 2 (Scram, —N). b = 0.003 vs. day 7 Scram. c = 0.023 vs. days 2 & 7 Scram. d < 0.02 vs. 7 (—OB) and day 14 (—N). (For interpretation of the references to colour in this figure legend, the reader is referred to the web version of this article.)

