Figure 6.

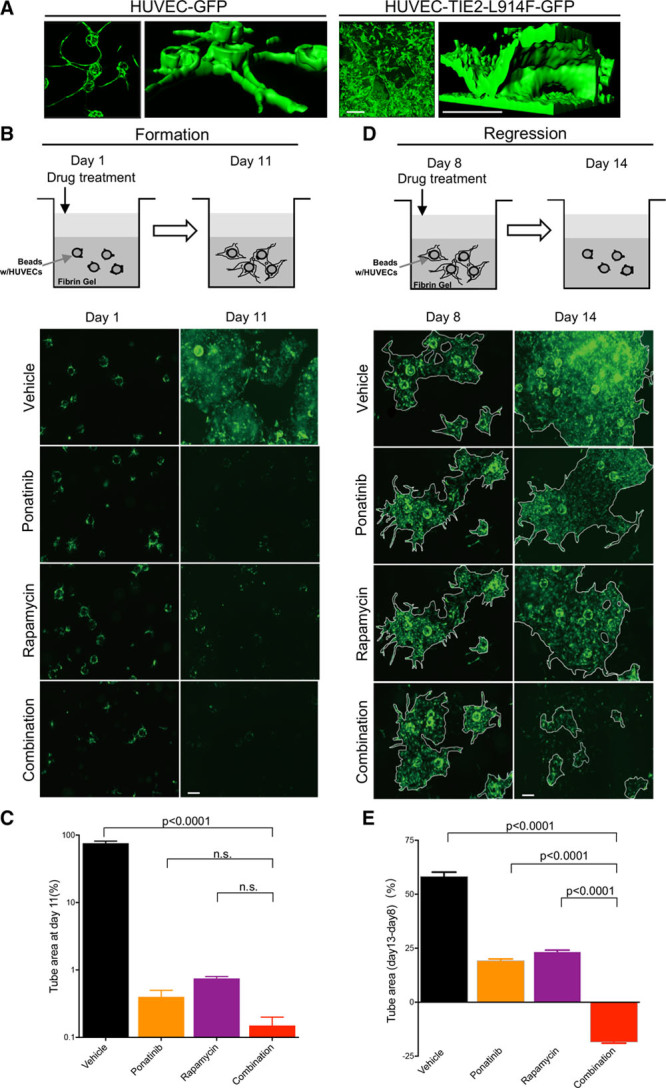
Ponatinib combined with rapamycin induces vascular channel regression in a 3-dimensional (3D) fibrin gel assay. A, Representative 2-dimensional (2D) images (left) and 3D structural models (right) of tubular networks formed by human umbilical vein endothelial cell (HUVEC)-GFP or HUVEC-TIE2-L914F-GFP. Scale bar: 200 μm. B, Treatment scheme of vascular network formation and representative 2D images taken on the same field at day 1 and 11. HUVEC-TIE2-L914F-GFP cells were treated with vehicle (dimethyl sulfoxide [DMSO]), 100 nmol/L ponatinib, 10 nmol/L rapamycin, or combination starting at day 1, when beads coated with cells were embedded in the fibrin gel. Scale bar: 200 μm. C, Quantification of tube/channel area. Data expressed as mean±SD, 1-way ANOVA for multiple comparisons (n=3 independent experiments). D, Treatment scheme of vascular network regression and representative 2D images taken on the same field at day 8 and 14. HUVEC TIE2-L914F-GFP cells were treated with vehicle (DMSO), 100 nmol/L ponatinib, 10 nmol/L rapamycin, or combination starting day 8 when tubular networks were already established. Scale bar: 200 μm. E, Quantification of vascular tube area change from day 8–14. Data expressed as mean±SD, 1-way ANOVA for multiple comparisons (representative of 2 independent experiments, n=3 wells each with 2–3 vascular channels analyzed).
