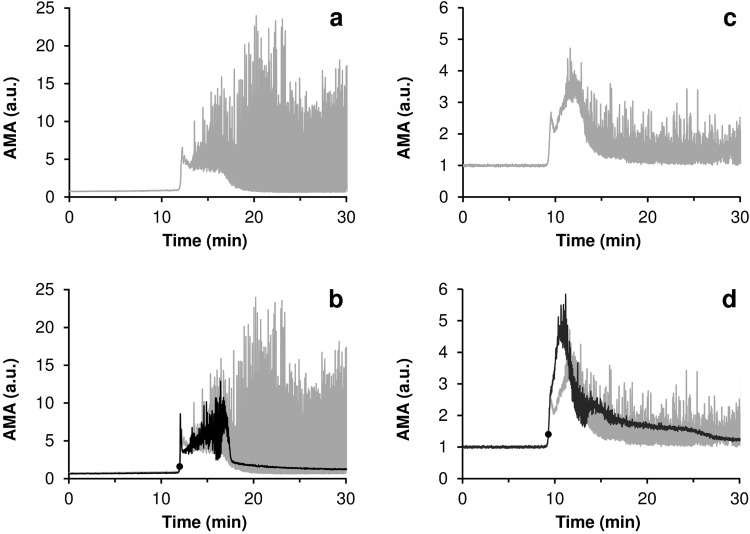
Fig 3. Typical curves of AMA (averaged modulus of amplitude of the acoustic signal) versus time for the experiments with a complete lysis of all macroscopic clots (black) in comparison with the reference curves obtained for the experiments in which no fibrinolytic drug was injected (gray).
The moments of the injection of streptokinase are marked on the graphs with bold round markers. (a,b)–experiments with blood plasma, final concentration of streptokinase– 150 IU/ml; (c,d)–experiments with whole blood, final concentration of streptokinase– 600 IU/ml.

