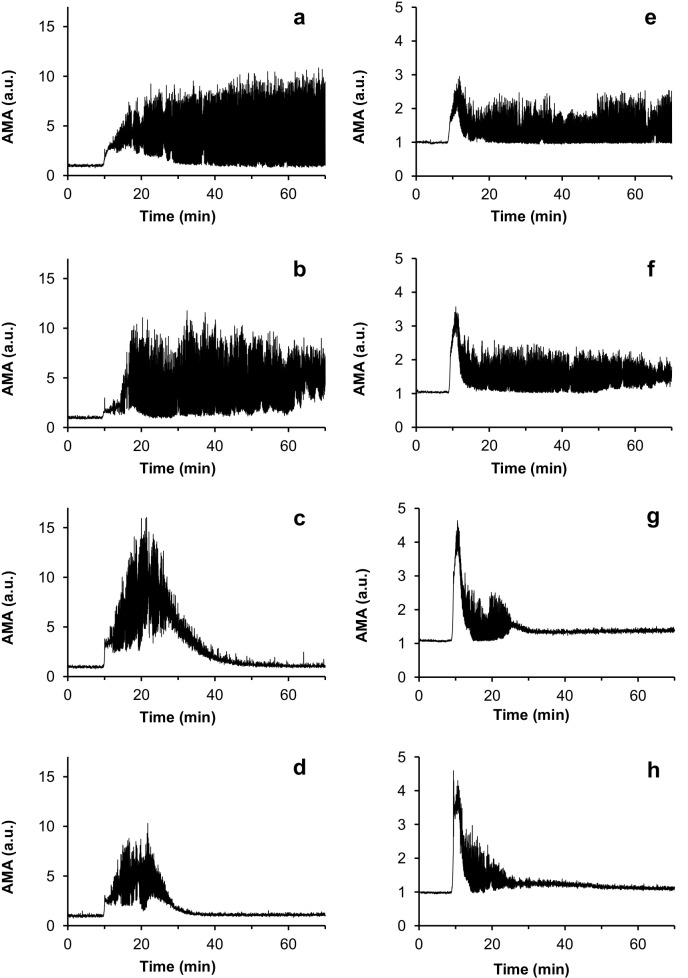
Fig 4. Curves of AMA (averaged modulus of amplitude of the acoustic signal) as a function of time for the experiments with different concentrations of urokinase injected.
(a,b,c,d)–sets of experiments with blood plasma; (e,f,g,h)–sets of experiments with whole blood. The urokinase concentrations used were as follows: (a,e)–reference experiments, normal saline was injected instead of a fibrinolytic drug; (b,f)– 200 IU/ml; (c,g)– 625 IU/ml; (d,h) – 1250 IU/ml.

