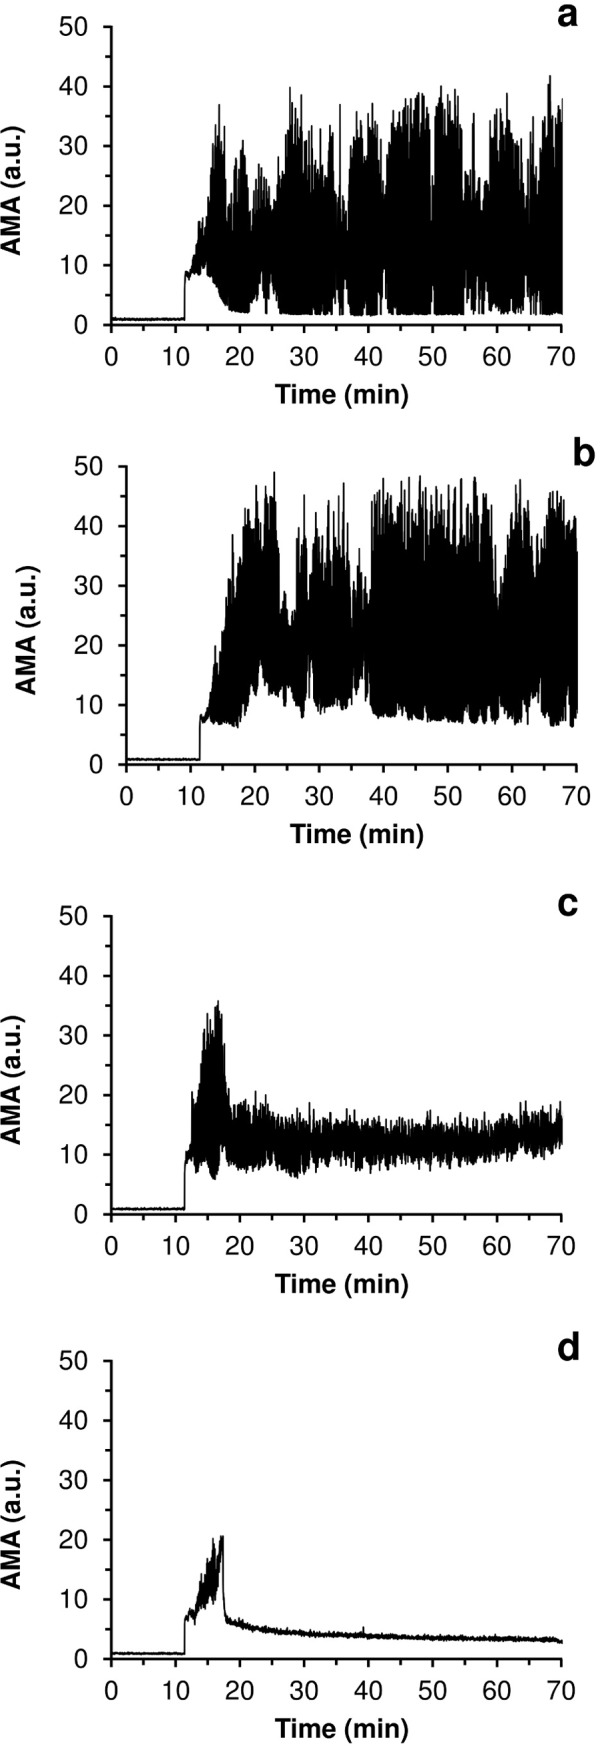
Fig 6. Curves of AMA versus time for an experimental series with different time delays of drug injection.

a–control experiment with no fibrinolytic drug injected; b–injection delay of 300 seconds; c—injection delay of 60 seconds; d–injection no delay. A concentration of streptokinase was 250 IU/ml.
