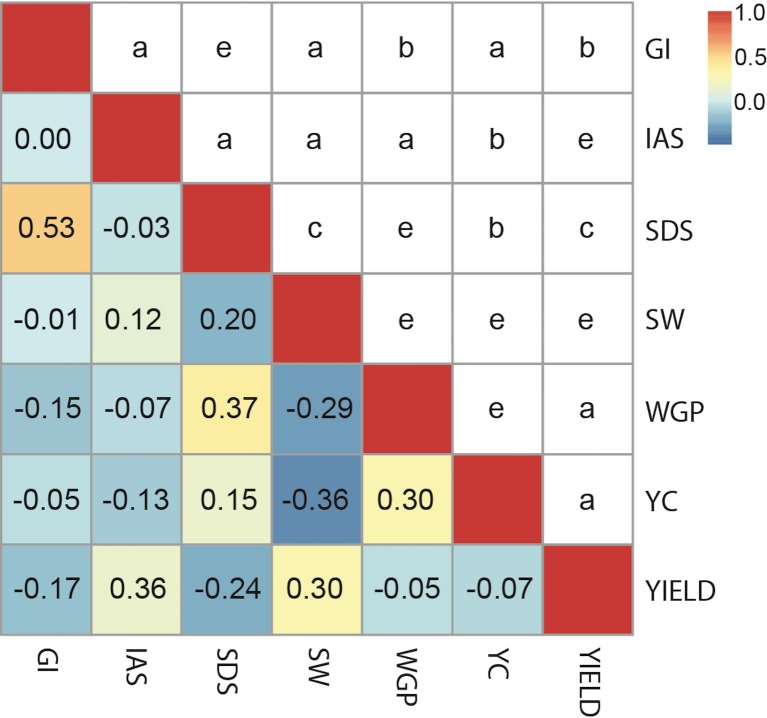
Fig 1. Phenotypic correlations found among assessed traits.
GI: gluten index; IAS: initial agronomic score; SDS: sedimentation index (SDS); SW: specific weight; WGP: whole grain protein; YC: yellow colour; and YIELD: grain yield. Above, the range for p-values was indicated using a scale from “a” to “e” (a: represents p-values larger than 0.1; b: represents values between 0.1 and 0.01; c: represents values between 0.01 and 0.001; d: indicates values between 0.001 and 0.0001; e: for values between 0.0001 and 0.00001); below, correlations are shown using a colour scale (highest correlations in red, lowest correlations in blue).

