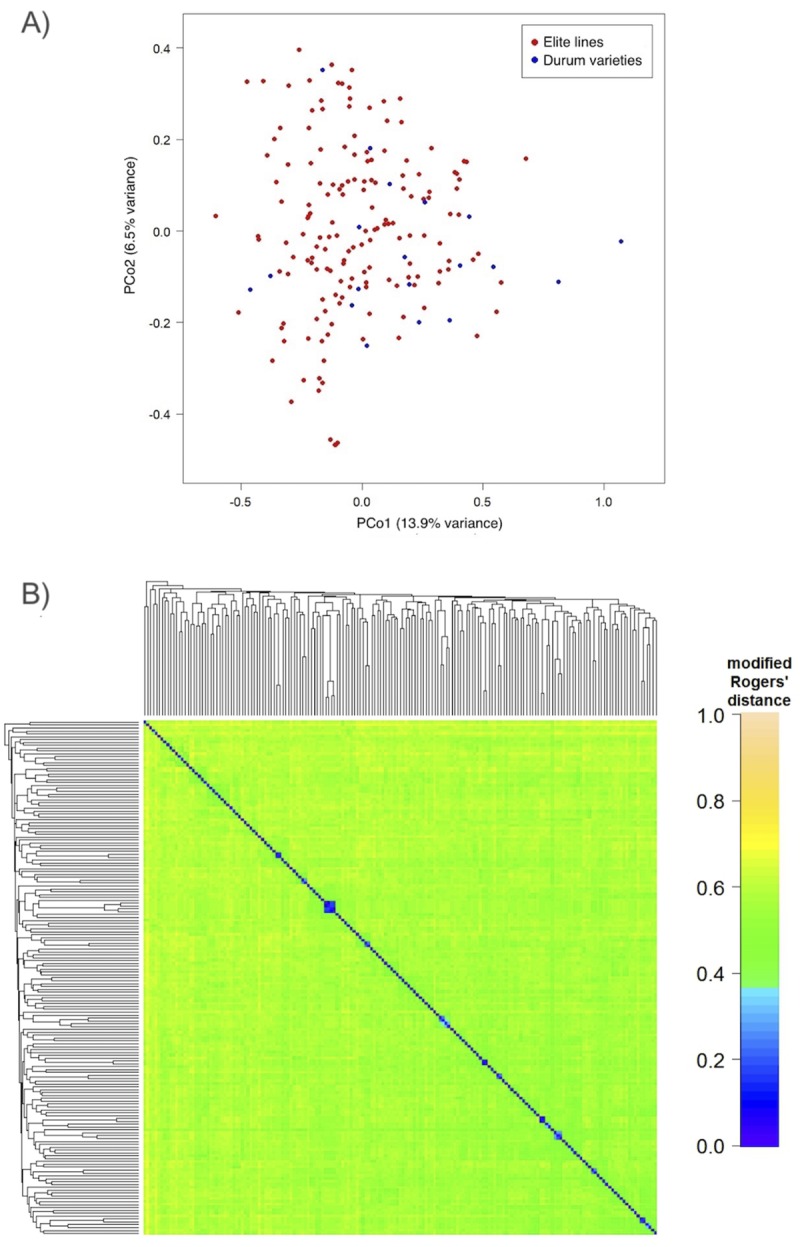
Fig 2. Population structure analysis.

a) Principal Coordinates Analysis (PCoA) of the durum wheat panel assessed. The graph shows first versus second coordinates; b) Heatmap showing pairwise modified Roger’s distance among 179 lines genotyped by 5,649 SNP markers. Average linkage clustering was used to order the lines.
