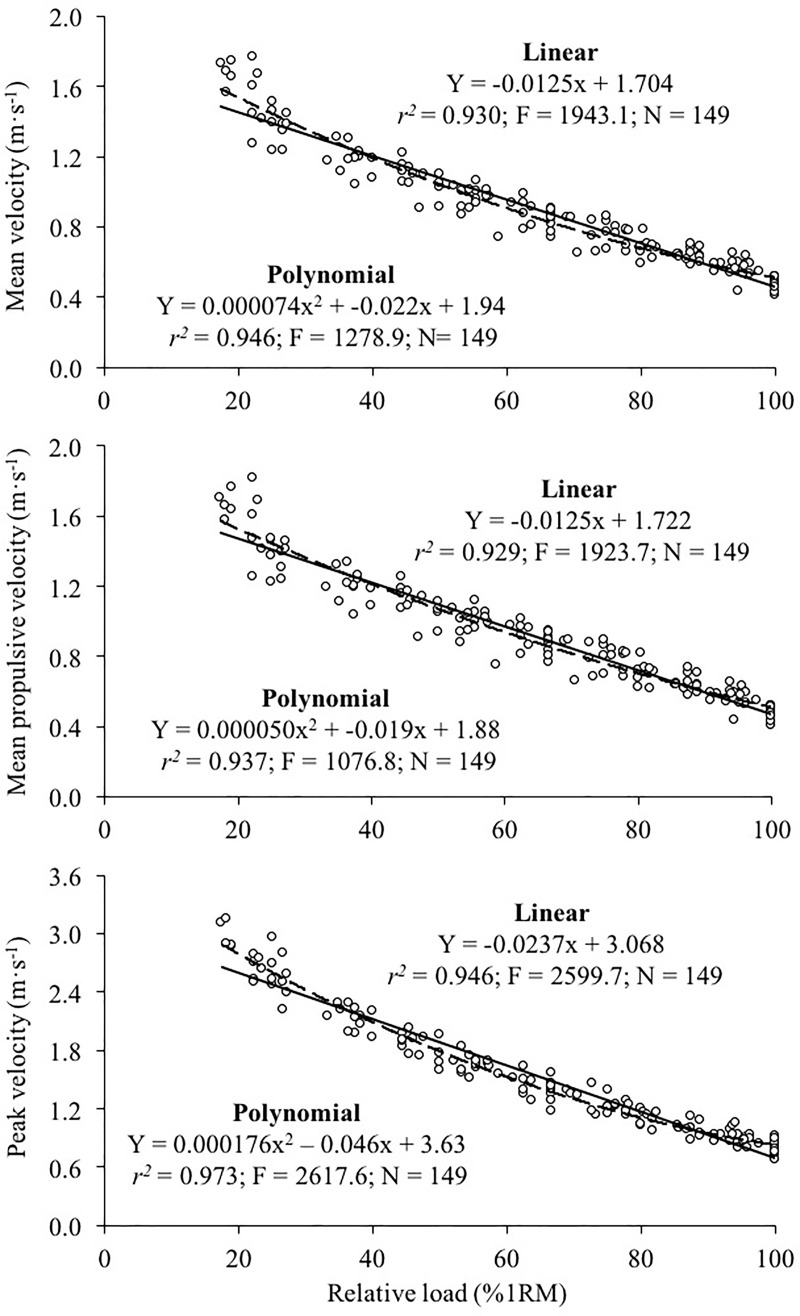
Fig 1.
Generalized across the subjects relationship between the relative load (%1RM) and mean velocity (upper panel), mean propulsive velocity (middle panel) and peak velocity (lower panel) in the bench pull exercise. The linear (solid line) and second-order polynomial (dashed line) regression equations are depicted. r2, Pearson's coefficient of determination; F, F statistic; N = number of trials included in the regression analysis.

