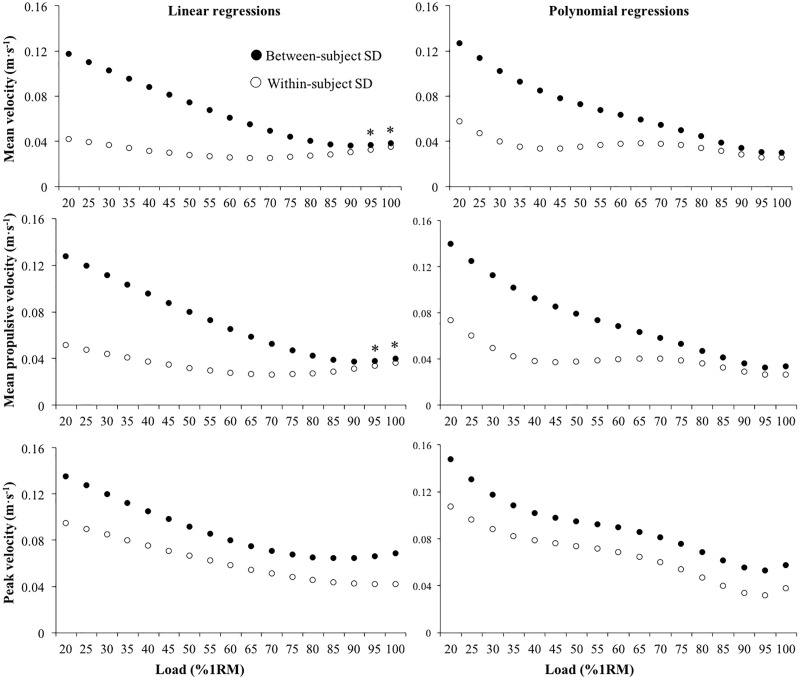
Fig 2.
Within-subject (empty circle) and between-subject (filled circle) standard deviation (SD) of the mean velocity (upper panels), mean propulsive velocity (middle panels) and peak velocity (lower panels) attained at each percentage of the one-repetition maximum (%1RM) obtained from linear (left panels) and second-order polynomial (right panels) regression models. *, CV ratio between within- and between-subject CVs < 1.1.

