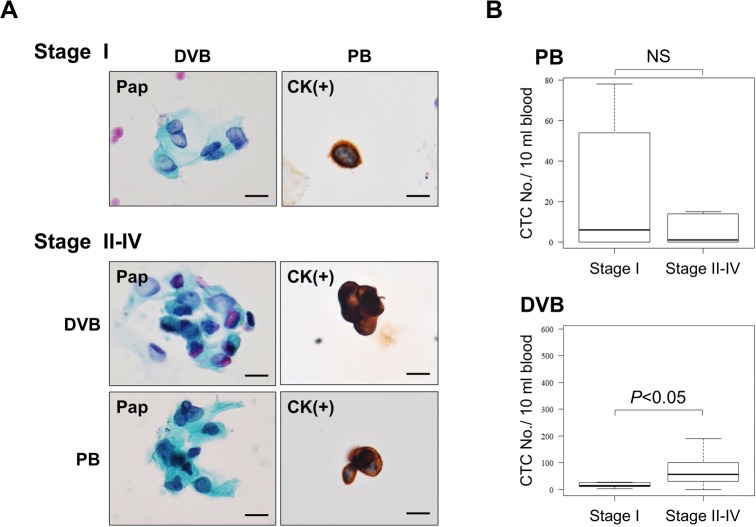
Fig 6. Numbers of CTCs in PB and DVB from CRC patients in relation to the tumor stage (I–IV).
(A) Representative CTCs stained by Pap and cytokeratin ICC from patients with stage I (upper) and stage II–IV CRC (lower). Bar = 10 μm. (B) Numbers of CTCs in PB and DVB from CRC patients according to stage. p<0.05 (Stage I vs Stage II–IV) for DVB. NS (= not significant) for PB. Bars = standard deviation (SD).

