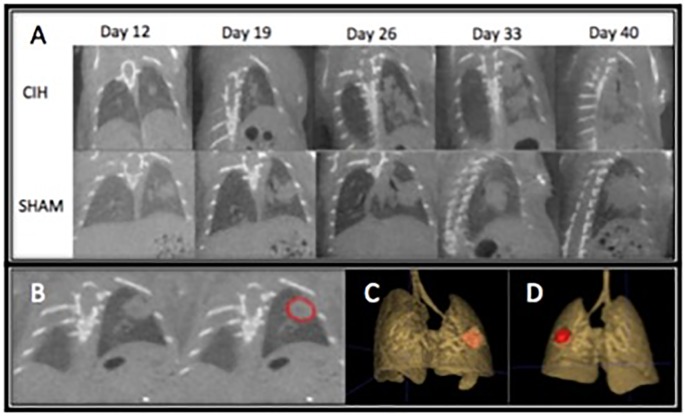
Fig 2. Representative micro CT of lung tumor progression.
(A) Representative single 2D coronal slice (largest length x width) of serial micro CT scans of one mouse exposed to cyclical intermittent hypoxia (upper panel) and one mouse exposed to room air (Sham) (lower panel) at 12, 19, 26, 33, and 40 days after Ad5CMVCre intrathoracic injection. (B) Using ITK snap, manual segmentation of the lung tumor, outlined in red, allows for precise 2D contouring of lung tumors in consecutive 100um coronal slices. C & D. ITK snap then automatically stitches all 2D segmented tumors and calculates a 3D tumor volume that is then used to compare CIH vs Sham tumor progression. A representative 3D tumor anterior (C) and posterior (D) visualization of a lung tumor from the same mouse in (B) is colored in red.

